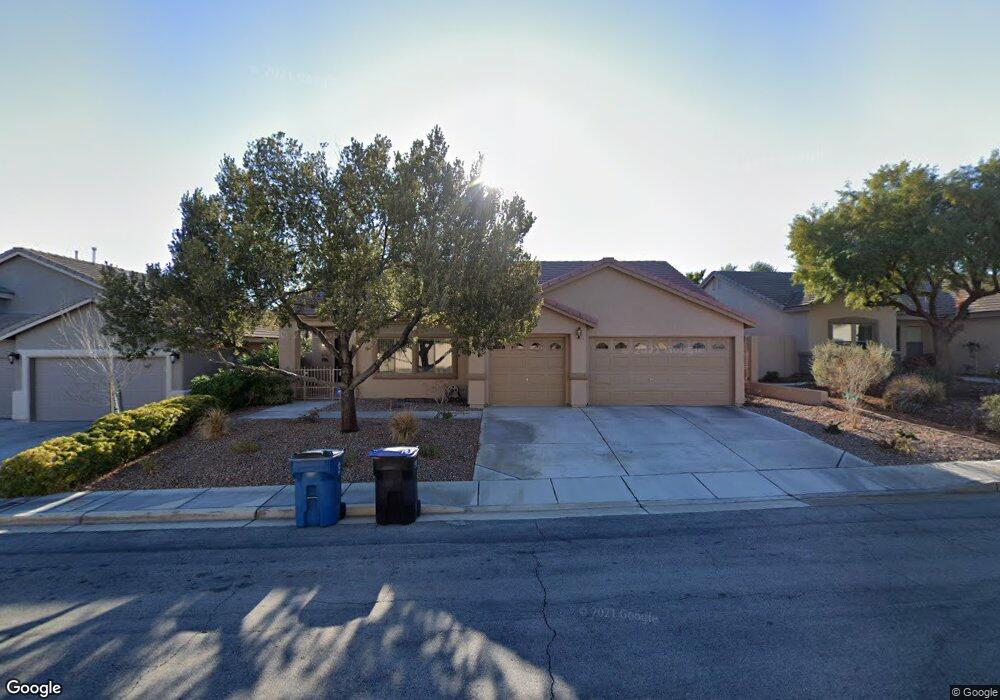
1795 Puerto Way Unit 5 Henderson, NV 89012
Green Valley Ranch NeighborhoodEstimated Value: $560,847 - $676,000
4
Beds
3
Baths
2,076
Sq Ft
$293/Sq Ft
Est. Value
About This Home
This home is located at 1795 Puerto Way Unit 5, Henderson, NV 89012 and is currently estimated at $607,712, approximately $292 per square foot. 1795 Puerto Way Unit 5 is a home located in Clark County with nearby schools including John Vanderburg Elementary School, Neil C. Twitchell Elementary School, and Bob Miller Middle School.
Ownership History
Date
Name
Owned For
Owner Type
Purchase Details
Closed on
Jun 5, 2025
Sold by
Macclendon Kaye and Lonsway Elizabeth
Bought by
Macclendon Lonsway Revocable Trust and Macclendon
Current Estimated Value
Purchase Details
Closed on
Apr 21, 2011
Sold by
Developers Marketing Solutions
Bought by
Macclendon Kaye and Lonsway Elizabeth
Home Financials for this Owner
Home Financials are based on the most recent Mortgage that was taken out on this home.
Original Mortgage
$196,879
Interest Rate
5.25%
Mortgage Type
FHA
Purchase Details
Closed on
Mar 22, 2011
Sold by
Litheredge Robert W and Litheredge Mary L
Bought by
Developers Marketing Solutions Llc
Home Financials for this Owner
Home Financials are based on the most recent Mortgage that was taken out on this home.
Original Mortgage
$196,879
Interest Rate
5.25%
Mortgage Type
FHA
Purchase Details
Closed on
Dec 17, 1997
Sold by
Clearwater Premiere Ltd Liability Co
Bought by
Litheredge Robert W and Litheredge Mary L
Create a Home Valuation Report for This Property
The Home Valuation Report is an in-depth analysis detailing your home's value as well as a comparison with similar homes in the area
Home Values in the Area
Average Home Value in this Area
Purchase History
| Date | Buyer | Sale Price | Title Company |
|---|---|---|---|
| Macclendon Lonsway Revocable Trust | -- | None Listed On Document | |
| Macclendon Kaye | $202,000 | Ticor Title Las Vegas | |
| Developers Marketing Solutions Llc | $160,000 | Ticor Title Las Vegas | |
| Litheredge Robert W | $163,500 | United Title |
Source: Public Records
Mortgage History
| Date | Status | Borrower | Loan Amount |
|---|---|---|---|
| Previous Owner | Macclendon Kaye | $196,879 | |
| Previous Owner | Developers Marketing Solutions Llc | $400,000 |
Source: Public Records
Tax History Compared to Growth
Tax History
| Year | Tax Paid | Tax Assessment Tax Assessment Total Assessment is a certain percentage of the fair market value that is determined by local assessors to be the total taxable value of land and additions on the property. | Land | Improvement |
|---|---|---|---|---|
| 2025 | $2,550 | $133,667 | $53,900 | $79,767 |
| 2024 | $2,477 | $133,667 | $53,900 | $79,767 |
| 2023 | $2,477 | $121,147 | $45,500 | $75,647 |
| 2022 | $2,405 | $110,983 | $41,650 | $69,333 |
| 2021 | $2,335 | $102,466 | $36,400 | $66,066 |
| 2020 | $2,264 | $101,906 | $36,400 | $65,506 |
| 2019 | $2,198 | $96,391 | $31,850 | $64,541 |
| 2018 | $2,134 | $90,255 | $28,000 | $62,255 |
| 2017 | $2,571 | $88,707 | $25,550 | $63,157 |
| 2016 | $2,021 | $82,118 | $17,850 | $64,268 |
| 2015 | $2,017 | $73,491 | $15,750 | $57,741 |
| 2014 | $1,958 | $68,669 | $12,250 | $56,419 |
Source: Public Records
Map
Nearby Homes
- 1780 Crystal Stream Ave
- 249 Gentle Springs Dr Unit 3
- 1798 Lakewood Dr
- 1740 Flores Ln
- 1724 Flores Ln
- 286 Fairmeadow St
- 229 Misty Garden St
- 256 Canyon Spirit Dr
- 1887 Eagle Flight Ln
- 47 Trailside Ct
- 211 Misty Garden St
- 1773 Lily Pond Cir
- 1628 Orange Daisy Place
- 1598 Signal Butte Way
- 1514 Emerald Peak Ave
- 1498 Rancho Navarro St
- 1785 Lily Pond Cir
- 1612 Yellow Tulip Place
- 195 Mountainside Dr
- 1590 Signal Butte Way
- 1793 Puerto Way
- 1797 Puerto Way
- 1790 Clear River Falls Ln
- 1788 Clear River Falls Ln
- 1791 Puerto Way
- 1799 Puerto Way
- 1799 Puerto Way Unit n/a
- 1790 Tumbling Falls Place
- 1792 Clear River Falls Ln
- 1786 Clear River Falls Ln
- 1792 Puerto Way
- 1789 Puerto Way
- 1801 Puerto Way
- 1794 Clear River Falls Ln
- 1784 Clear River Falls Ln
- 1792 Tumbling Falls Place Unit 5
- 1790 Puerto Way
- 1791 Tumbling Falls Place Unit 5
- 1787 Puerto Way
- 1803 Puerto Way