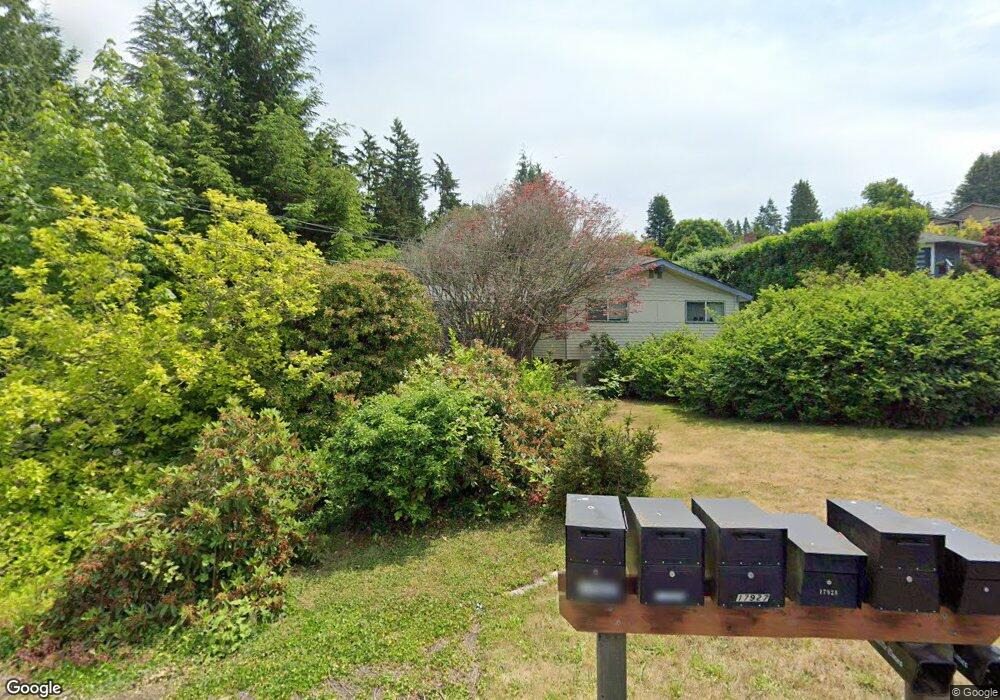
17951 Talbot Rd Edmonds, WA 98026
Talbot Park NeighborhoodEstimated Value: $1,371,123 - $1,541,000
5
Beds
3
Baths
1,728
Sq Ft
$830/Sq Ft
Est. Value
About This Home
This home is located at 17951 Talbot Rd, Edmonds, WA 98026 and is currently estimated at $1,435,031, approximately $830 per square foot. 17951 Talbot Rd is a home located in Snohomish County with nearby schools including Edmonds Elementary School, Meadowdale Middle School, and Meadowdale High School.
Ownership History
Date
Name
Owned For
Owner Type
Purchase Details
Closed on
Aug 16, 2021
Sold by
Hollcraft Jeffrey T and Estate Of Marjorie F Hollcraft
Bought by
Hollcraft Jeffrey T
Current Estimated Value
Create a Home Valuation Report for This Property
The Home Valuation Report is an in-depth analysis detailing your home's value as well as a comparison with similar homes in the area
Home Values in the Area
Average Home Value in this Area
Purchase History
| Date | Buyer | Sale Price | Title Company |
|---|---|---|---|
| Hollcraft Jeffrey T | -- | None Available |
Source: Public Records
Tax History Compared to Growth
Tax History
| Year | Tax Paid | Tax Assessment Tax Assessment Total Assessment is a certain percentage of the fair market value that is determined by local assessors to be the total taxable value of land and additions on the property. | Land | Improvement |
|---|---|---|---|---|
| 2025 | $7,801 | $1,172,500 | $763,900 | $408,600 |
| 2024 | $7,801 | $1,105,600 | $718,000 | $387,600 |
| 2023 | $8,267 | $1,214,400 | $759,800 | $454,600 |
| 2022 | $7,786 | $940,500 | $557,200 | $383,300 |
| 2020 | $7,275 | $783,400 | $535,400 | $248,000 |
| 2019 | $6,505 | $706,000 | $462,200 | $243,800 |
| 2018 | $7,018 | $658,000 | $439,400 | $218,600 |
| 2017 | $5,785 | $568,100 | $371,000 | $197,100 |
| 2016 | $5,179 | $504,300 | $315,000 | $189,300 |
| 2015 | $5,431 | $498,000 | $320,700 | $177,300 |
| 2013 | $4,407 | $381,600 | $225,000 | $156,600 |
Source: Public Records
Map
Nearby Homes
- 8608 185th Place SW
- 8036 Cyrus Place
- 8001 Talbot Rd
- 192 XX Olympic View Dr
- 7525 178th Place SW
- 18757 76th Ave W
- 18312 73rd Ave W
- 19523 86th Ave W Unit 523
- 7469 174th St SW
- 157 xx 72nd Ave W
- 8516 196th St SW Unit 105
- 8516 196th St SW Unit 302
- 8516 196th St SW Unit 206
- 8516 196th St SW Unit 311
- 8019 196th St SW Unit C4
- 1514 9th Ave N
- 17008 72nd Place W
- 1030 Grandview St
- 16530 76th Ave W
- 1414 9th Ave N Unit 105
- 18003 Talbot Rd
- 17927 Talbot Rd
- 18010 88th Ave W
- 18005 Talbot Rd
- 18015 Talbot Rd
- 8801 Olympic View Dr
- 8809 Olympic View Dr
- 8928 179th Place SW
- 17928 Talbot Rd
- 17905 Talbot Rd
- 231 85th Place W
- 18017 Talbot Rd
- 8930 179th Place SW
- 8727 Olympic View Dr
- 18004 Talbot Rd
- 17839 Talbot Rd
- 18020 Talbot Rd
- 8932 179th Place SW
- 17966 Talbot Rd
- 18107 88th Ave W