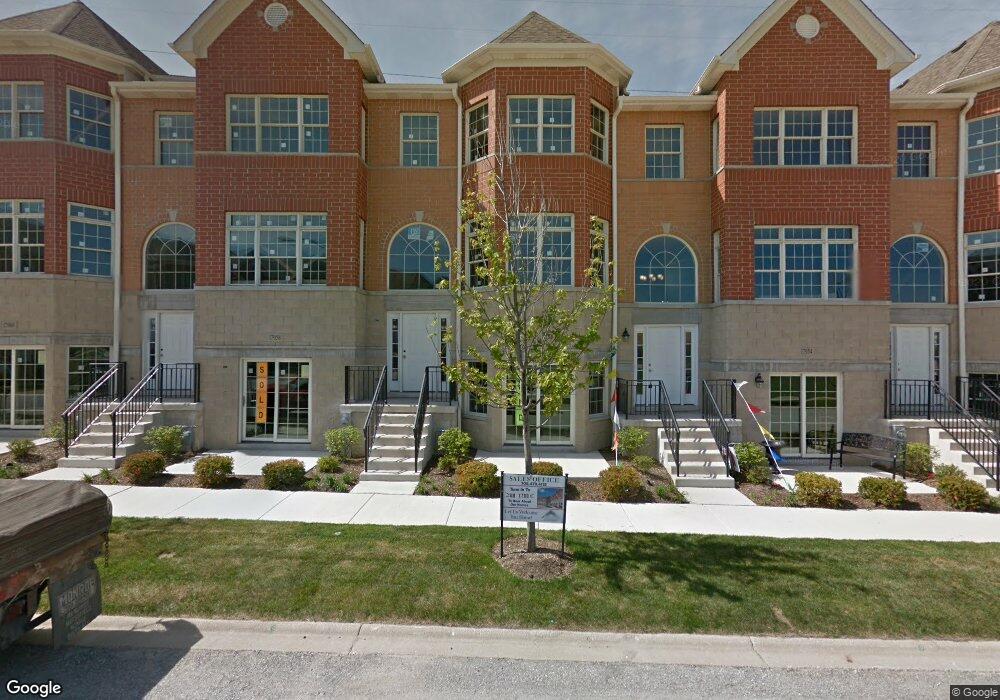
17956 Fountain Cir Unit 19 Orland Park, IL 60467
Grasslands NeighborhoodEstimated Value: $436,000 - $457,000
3
Beds
4
Baths
2,550
Sq Ft
$175/Sq Ft
Est. Value
About This Home
This home is located at 17956 Fountain Cir Unit 19, Orland Park, IL 60467 and is currently estimated at $446,231, approximately $174 per square foot. 17956 Fountain Cir Unit 19 is a home located in Cook County with nearby schools including Meadow Ridge School, Orland Center School, and Century Junior High School.
Ownership History
Date
Name
Owned For
Owner Type
Purchase Details
Closed on
Aug 26, 2020
Sold by
Masterson Martin and Kenny Aileen
Bought by
Weisbrod Candace Brooke
Current Estimated Value
Home Financials for this Owner
Home Financials are based on the most recent Mortgage that was taken out on this home.
Original Mortgage
$296,100
Interest Rate
2.87%
Mortgage Type
New Conventional
Purchase Details
Closed on
May 20, 2013
Sold by
State Bank
Bought by
Masterson Martin J and Kenny Aileen M
Home Financials for this Owner
Home Financials are based on the most recent Mortgage that was taken out on this home.
Original Mortgage
$231,900
Interest Rate
3.5%
Mortgage Type
New Conventional
Create a Home Valuation Report for This Property
The Home Valuation Report is an in-depth analysis detailing your home's value as well as a comparison with similar homes in the area
Home Values in the Area
Average Home Value in this Area
Purchase History
| Date | Buyer | Sale Price | Title Company |
|---|---|---|---|
| Weisbrod Candace Brooke | $329,000 | Saturn Title Llc | |
| Masterson Martin J | $290,000 | Title Guaranty Fund Inc |
Source: Public Records
Mortgage History
| Date | Status | Borrower | Loan Amount |
|---|---|---|---|
| Previous Owner | Weisbrod Candace Brooke | $296,100 | |
| Previous Owner | Masterson Martin J | $231,900 |
Source: Public Records
Tax History Compared to Growth
Tax History
| Year | Tax Paid | Tax Assessment Tax Assessment Total Assessment is a certain percentage of the fair market value that is determined by local assessors to be the total taxable value of land and additions on the property. | Land | Improvement |
|---|---|---|---|---|
| 2024 | $8,330 | $36,601 | $806 | $35,795 |
| 2023 | $8,547 | $36,601 | $806 | $35,795 |
| 2022 | $8,547 | $28,533 | $1,266 | $27,267 |
| 2021 | $8,255 | $28,533 | $1,266 | $27,267 |
| 2020 | $7,082 | $28,533 | $1,266 | $27,267 |
| 2019 | $6,620 | $27,547 | $1,151 | $26,396 |
| 2018 | $6,437 | $27,547 | $1,151 | $26,396 |
| 2017 | $6,307 | $27,547 | $1,151 | $26,396 |
| 2016 | $6,814 | $26,918 | $1,035 | $25,883 |
| 2015 | $7,298 | $29,032 | $1,035 | $27,997 |
| 2014 | $7,205 | $29,032 | $1,035 | $27,997 |
| 2013 | $7,600 | $29,494 | $1,035 | $28,459 |
Source: Public Records
Map
Nearby Homes
- 11101 W 179th St
- 10935 California Ct Unit 185
- 9601 W 179th St
- 17816 New Hampshire Ct Unit 137
- 17921 Alaska Ct Unit 8
- 17926 Alabama Ct Unit 5
- 11108 Waters Edge Dr
- 10958 New Mexico Ct Unit 166
- 17708 Pennsylvania Ct Unit 211
- 18028 Esther Dr
- 11228 Cameron Pkwy
- 10816 Kimberly Ln Unit 48
- 10638 Melissa Dr Unit 104
- 17950 Settlers Pond Way Unit 3B
- 18233 Michigan Ct Unit 73
- 11508 Lake Shore Dr
- 10549 Illinois Ct Unit 184
- 10459 Eagle Ridge Dr Unit 139
- 18011 Breckenridge Blvd
- 18145 Breckenridge Blvd
- 17956 Fountain Cir
- 17954 Fountain Cir
- 17954 Fountain Cir Unit 25
- 17952 Fountain Cir
- 17960 Fountain Cir
- 17962 Fountain Cir
- 17950 Fountain Cir
- 17948 Fountain Cir
- 17944 Fountain Cir
- 17942 Fountain Cir
- 17951 Fountain Cir
- 17949 Fountain Cir
- 17949 Fountain Cir Unit 26A
- 17947 Fountain Cir
- 17945 Fountain Cir
- 17940 Fountain Cir
- 17943 Fountain Cir
- 17959 Fountain Cir
- 17961 Fountain Cir
- 17961 Fountain Cir Unit 20