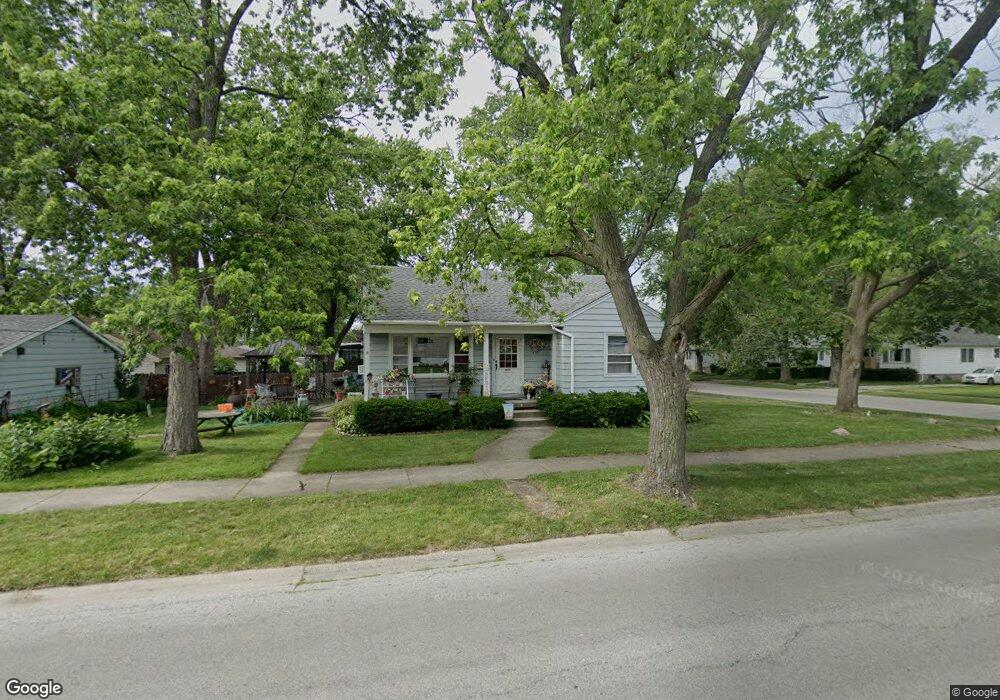
17958 Lorenz Ave Lansing, IL 60438
Estimated Value: $122,612 - $196,000
2
Beds
1
Bath
925
Sq Ft
$177/Sq Ft
Est. Value
About This Home
This home is located at 17958 Lorenz Ave, Lansing, IL 60438 and is currently estimated at $163,653, approximately $176 per square foot. 17958 Lorenz Ave is a home located in Cook County with nearby schools including Coolidge Elementary School, Memorial Jr High School, and Thornton Fractnl So High School.
Ownership History
Date
Name
Owned For
Owner Type
Purchase Details
Closed on
Feb 17, 2004
Sold by
Rubbens Mary K and Matyasik Mary K
Bought by
Matasik Donald and Matyasik Mary K
Current Estimated Value
Home Financials for this Owner
Home Financials are based on the most recent Mortgage that was taken out on this home.
Original Mortgage
$103,100
Outstanding Balance
$23,575
Interest Rate
5.74%
Mortgage Type
FHA
Estimated Equity
$140,078
Purchase Details
Closed on
Apr 7, 2000
Sold by
Todd Walter Edward
Bought by
Matyasik Donald and Rubbens Mary K
Home Financials for this Owner
Home Financials are based on the most recent Mortgage that was taken out on this home.
Original Mortgage
$93,200
Interest Rate
8.31%
Mortgage Type
FHA
Purchase Details
Closed on
Mar 25, 1998
Sold by
Todd Eugene W
Bought by
Todd Walter Edward and Trust #98-269
Create a Home Valuation Report for This Property
The Home Valuation Report is an in-depth analysis detailing your home's value as well as a comparison with similar homes in the area
Home Values in the Area
Average Home Value in this Area
Purchase History
| Date | Buyer | Sale Price | Title Company |
|---|---|---|---|
| Matasik Donald | -- | First American Title | |
| Matyasik Donald | $94,000 | -- | |
| Todd Walter Edward | -- | -- |
Source: Public Records
Mortgage History
| Date | Status | Borrower | Loan Amount |
|---|---|---|---|
| Open | Matasik Donald | $103,100 | |
| Closed | Matyasik Donald | $93,200 |
Source: Public Records
Tax History Compared to Growth
Tax History
| Year | Tax Paid | Tax Assessment Tax Assessment Total Assessment is a certain percentage of the fair market value that is determined by local assessors to be the total taxable value of land and additions on the property. | Land | Improvement |
|---|---|---|---|---|
| 2024 | $232 | $5,264 | $1,328 | $3,936 |
| 2023 | $322 | $5,264 | $1,328 | $3,936 |
| 2022 | $322 | $4,866 | $1,172 | $3,694 |
| 2021 | $305 | $4,865 | $1,171 | $3,694 |
| 2020 | $264 | $4,865 | $1,171 | $3,694 |
| 2019 | $0 | $3,933 | $1,093 | $2,840 |
| 2018 | $1,238 | $3,933 | $1,093 | $2,840 |
| 2017 | $1,267 | $3,933 | $1,093 | $2,840 |
| 2016 | $1,465 | $3,927 | $1,015 | $2,912 |
| 2015 | $1,329 | $3,927 | $1,015 | $2,912 |
| 2014 | $1,324 | $3,927 | $1,015 | $2,912 |
| 2013 | $1,482 | $4,605 | $1,015 | $3,590 |
Source: Public Records
Map
Nearby Homes
- 18013 Park Ave
- 18019 Lorenz Ave
- 18018 Park Ave
- 17943 Ridgewood Ave
- 17913 Oakwood Ave
- 17925 Walter St
- 18034 Ridgewood Ave
- 19510 Burnham Ave
- 18017 Oakwood Ave
- 17926 Roy St
- 17946 Roy St
- 17745 Burnham Ave
- 3238 178th St
- 17919 School St
- 18101 Wildwood Ave
- 2914 Ridge Rd
- 18136 Oakwood Ave
- 17641 Burnham Ave
- 2745 179th St
- 3336 178th St
- 17958 Lorenz Ave
- 17954 Lorenz Ave
- 17954 Lorenz Ave
- 17950 Lorenz Ave
- 17950 Lorenz Ave
- 18004 Lorenz Ave
- 18004 Lorenz Ave
- 17942 Lorenz Ave
- 17942 Lorenz Ave
- 17957 Park Ave
- 17957 Park Ave
- 17953 Park Ave
- 17953 Park Ave
- 17947 Park Ave
- 18008 Lorenz Ave
- 18008 Lorenz Ave
- 18003 Park Ave
- 18003 Park Ave
- 17941 Park Ave
- 17941 Park Ave