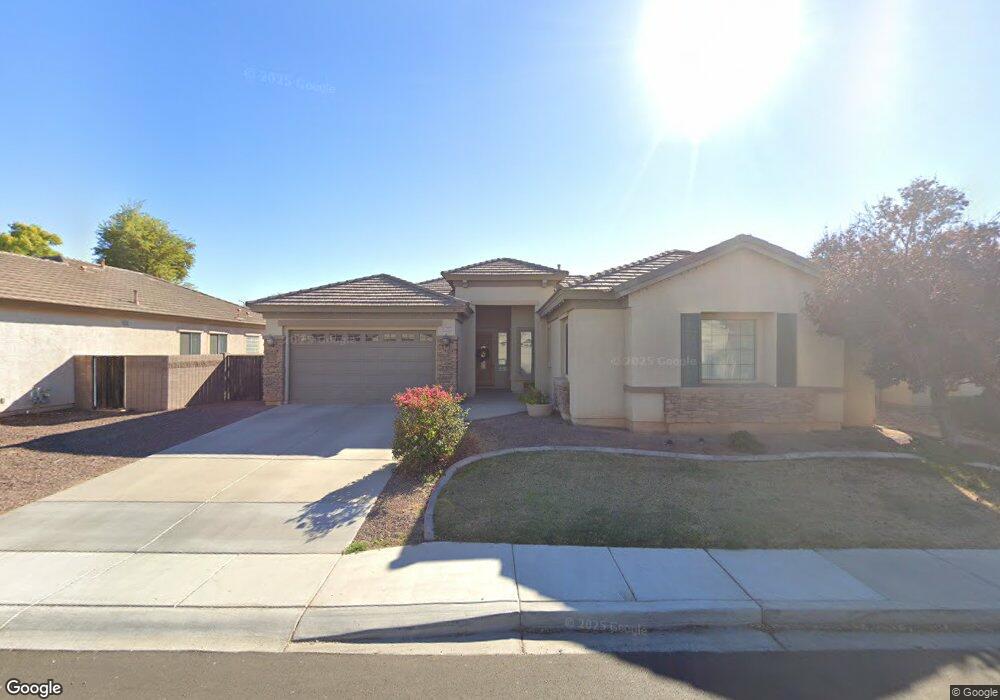
1797 E Glacier Place Chandler, AZ 85249
South Chandler NeighborhoodEstimated Value: $638,442 - $776,000
Studio
3
Baths
2,803
Sq Ft
$259/Sq Ft
Est. Value
About This Home
This home is located at 1797 E Glacier Place, Chandler, AZ 85249 and is currently estimated at $724,861, approximately $258 per square foot. 1797 E Glacier Place is a home located in Maricopa County with nearby schools including Santan Elementary School, Santan Junior High School, and Legacy Traditional School - Chandler.
Ownership History
Date
Name
Owned For
Owner Type
Purchase Details
Closed on
Sep 26, 2006
Sold by
The Alazu Family Llp #1 and Morgan Alan M
Bought by
Morgan Alan M and Morgan Azucena M
Current Estimated Value
Purchase Details
Closed on
Feb 28, 2005
Sold by
Morgan Alan M and Morgan Azucena M
Bought by
Morgan Alan M and Morgan Azucena M
Purchase Details
Closed on
Jul 23, 2004
Sold by
Fulton Homes Sales Corp
Bought by
Morgan Alan M and Morgan Azucena M
Home Financials for this Owner
Home Financials are based on the most recent Mortgage that was taken out on this home.
Original Mortgage
$265,970
Interest Rate
6.29%
Mortgage Type
New Conventional
Create a Home Valuation Report for This Property
The Home Valuation Report is an in-depth analysis detailing your home's value as well as a comparison with similar homes in the area
Home Values in the Area
Average Home Value in this Area
Purchase History
We collect this data history from publicly available records. To have your information removed, we recommend requesting removal directly through your county’s website.
| Date | Buyer | Sale Price | Title Company |
|---|---|---|---|
| Morgan Alan M | -- | None Available | |
| Morgan Alan M | -- | -- | |
| Morgan Alan M | $264,717 | -- | |
| Fulton Homes Sales Corp | $199,280 | -- |
Source: Public Records
Mortgage History
We collect this data history from publicly available records. To have your information removed, we recommend requesting removal directly through your county’s website.
| Date | Status | Borrower | Loan Amount |
|---|---|---|---|
| Closed | Morgan Alan M | $265,970 |
Source: Public Records
Tax History
| Year | Tax Paid | Tax Assessment Tax Assessment Total Assessment is a certain percentage of the fair market value that is determined by local assessors to be the total taxable value of land and additions on the property. | Land | Improvement |
|---|---|---|---|---|
| 2025 | $3,017 | $38,192 | -- | -- |
| 2024 | $2,915 | $36,373 | -- | -- |
| 2023 | $2,915 | $51,800 | $10,360 | $41,440 |
| 2022 | $2,815 | $37,920 | $7,580 | $30,340 |
| 2021 | $2,941 | $35,580 | $7,110 | $28,470 |
| 2020 | $2,927 | $34,970 | $6,990 | $27,980 |
| 2019 | $2,816 | $32,350 | $6,470 | $25,880 |
| 2018 | $2,725 | $28,760 | $5,750 | $23,010 |
| 2017 | $2,542 | $29,080 | $5,810 | $23,270 |
| 2016 | $2,449 | $28,600 | $5,720 | $22,880 |
| 2015 | $2,370 | $28,010 | $5,600 | $22,410 |
Source: Public Records
Map
Nearby Homes
- 4450 S Rio Dr
- 4475 S John Way
- 1945 E Aloe Place
- 1625 E Aloe Place
- 3892 S Tower Ave
- 1491 E Yellowstone Place
- 2102 E Yellowstone Place
- 1397 E Glacier Place
- 1434 E Tonto Dr
- 1748 E Iris Dr
- 1377 E Glacier Place
- 1718 E Iris Dr
- 2193 E Coconino Place
- 2203 E Tonto Place
- 2176 E Aloe Place
- 1767 E Carob Dr
- 1707 E Carob Dr
- 2106 E Crescent Place
- 3673 S Soho Ln
- 3824 S Wayne Dr
- 1777 E Glacier Place
- 1817 E Glacier Place
- 1837 E Glacier Place
- 1796 E Glacier Place
- 1816 E Glacier Place
- 1836 E Glacier Place
- 1782 E Kaibab Dr
- 1857 E Glacier Place
- 1762 E Kaibab Dr
- 1802 E Kaibab Dr
- 1856 E Glacier Place
- 1822 E Kaibab Dr
- 4197 S Marion Place
- 1795 E Grand Canyon Dr
- 1815 E Grand Canyon Dr
- 1835 E Grand Canyon Dr
- 1876 E Glacier Place
- 4177 S Marion Place
- 1842 E Kaibab Dr
- 4257 S Marion Place
Your Personal Tour Guide
Ask me questions while you tour the home.