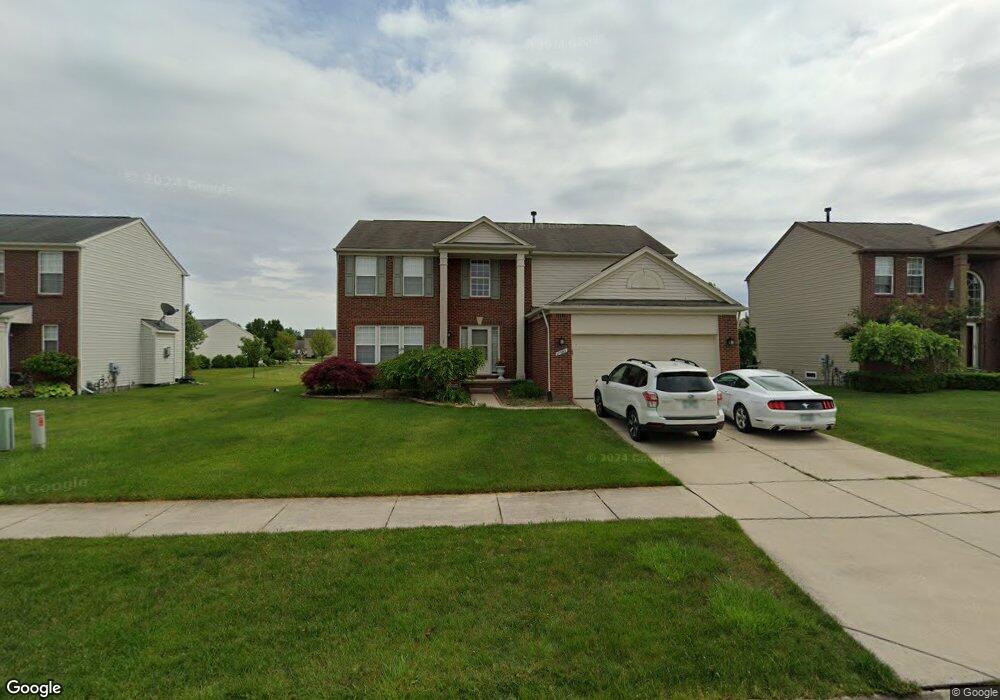
17982 Troon Trail Unit Bldg-Unit Macomb, MI 48042
Estimated Value: $430,000 - $441,862
--
Bed
3
Baths
2,553
Sq Ft
$171/Sq Ft
Est. Value
About This Home
This home is located at 17982 Troon Trail Unit Bldg-Unit, Macomb, MI 48042 and is currently estimated at $435,466, approximately $170 per square foot. 17982 Troon Trail Unit Bldg-Unit is a home located in Macomb County with nearby schools including New Haven High School, St. Peter Lutheran School, and Lutheran North High School.
Ownership History
Date
Name
Owned For
Owner Type
Purchase Details
Closed on
Jul 21, 2025
Sold by
Page Justin
Bought by
Holtgrave Travis S and Conforti Alyssa
Current Estimated Value
Home Financials for this Owner
Home Financials are based on the most recent Mortgage that was taken out on this home.
Original Mortgage
$344,000
Outstanding Balance
$343,416
Interest Rate
6.84%
Mortgage Type
New Conventional
Estimated Equity
$92,050
Purchase Details
Closed on
Mar 20, 2018
Sold by
Zegadlo Derek and Zegadlo Tonya
Bought by
Page Justin
Purchase Details
Closed on
Mar 29, 2017
Sold by
Clyne Alissa and Kotsis Alissa
Bought by
Zegadlo Derek and Zegadlo Tonya
Purchase Details
Closed on
Jan 16, 2009
Sold by
Liu Eysion A and Li Jin
Bought by
Kotsis Alissa
Purchase Details
Closed on
Sep 29, 2003
Sold by
Pulte Land Co Llc
Bought by
Liu Eysion A and Li Jin
Create a Home Valuation Report for This Property
The Home Valuation Report is an in-depth analysis detailing your home's value as well as a comparison with similar homes in the area
Home Values in the Area
Average Home Value in this Area
Purchase History
| Date | Buyer | Sale Price | Title Company |
|---|---|---|---|
| Holtgrave Travis S | $430,000 | State Street Title | |
| Holtgrave Travis S | $430,000 | State Street Title | |
| Page Justin | $275,000 | None Available | |
| Zegadlo Derek | $265,000 | Bankers Title Settlement | |
| Kotsis Alissa | $190,000 | Title One Inc | |
| Liu Eysion A | $56,250 | Metropolitan Title Company |
Source: Public Records
Mortgage History
| Date | Status | Borrower | Loan Amount |
|---|---|---|---|
| Open | Holtgrave Travis S | $344,000 | |
| Closed | Holtgrave Travis S | $344,000 |
Source: Public Records
Tax History Compared to Growth
Tax History
| Year | Tax Paid | Tax Assessment Tax Assessment Total Assessment is a certain percentage of the fair market value that is determined by local assessors to be the total taxable value of land and additions on the property. | Land | Improvement |
|---|---|---|---|---|
| 2025 | $5,423 | $211,300 | $0 | $0 |
| 2024 | $3,450 | $205,700 | $0 | $0 |
| 2023 | $3,270 | $184,500 | $0 | $0 |
| 2022 | $4,918 | $161,300 | $0 | $0 |
| 2021 | $4,784 | $152,000 | $0 | $0 |
| 2020 | $3,006 | $149,800 | $0 | $0 |
| 2019 | $5,735 | $142,400 | $0 | $0 |
| 2018 | $4,340 | $135,000 | $0 | $0 |
| 2017 | $3,526 | $123,550 | $30,000 | $93,550 |
| 2016 | $2,986 | $123,550 | $0 | $0 |
| 2015 | $2,994 | $114,180 | $0 | $0 |
| 2014 | $2,994 | $104,930 | $17,000 | $87,930 |
| 2011 | $970 | $101,840 | $15,000 | $86,840 |
Source: Public Records
Map
Nearby Homes
- 56501 Winding Creek Dr
- 56700 Honey Ct
- 56782 Inland Ct
- 56772 Cardinal Dr
- 17952 Marsal Dr
- 17829 Stallman Dr
- 56895 Topaz Dr
- 55649 Faldo Dr Unit 141
- 18064 Stallman Dr
- 56098 Walker Ct
- 18240 Stallmann Dr
- 18498 London Dr Unit Lot 10
- 18005 Player Dr
- 18037 Player Dr
- 55802 Jones Dr
- 55841 Jones Dr Unit 114
- 17541 Stallman Dr Unit 89
- 56543 Hastings Dr
- 55809 Jones Dr Unit 113
- 17835 Player Dr
- 18010 Troon Trail
- 17954 Troon Trail
- 56421 Desert Ct
- 18038 Troon Trail
- 56571 Honey Ct
- 56504 Oasis Dr
- 56480 Oasis Dr
- 56410 Desert Ct
- 56397 Desert Ct
- 17945 Troon Trail
- 18066 Troon Trail
- 56456 Oasis Dr
- 17917 Troon Trail
- 56603 Honey Ct
- 56560 Honey Ct
- 56432 Oasis Dr
- 56386 Desert Ct
- 17889 Troon Trail
- 56373 Desert Ct
- 56588 Honey Ct