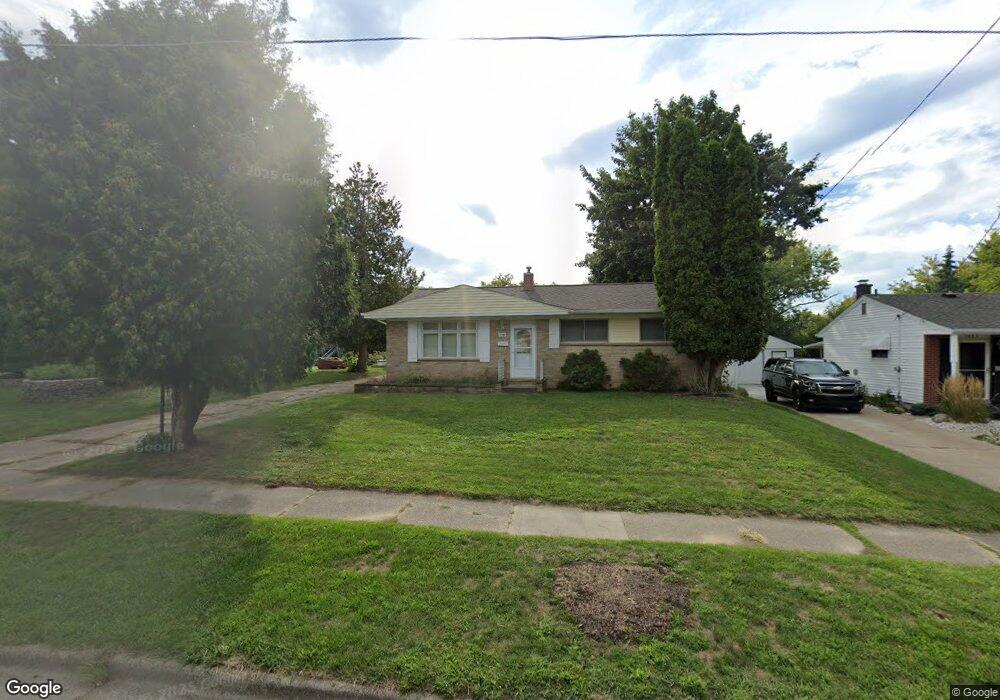
1799 Benjamin Ave NE Grand Rapids, MI 49505
North East Citizens Action NeighborhoodEstimated Value: $261,000 - $314,000
3
Beds
1
Bath
1,700
Sq Ft
$165/Sq Ft
Est. Value
About This Home
This home is located at 1799 Benjamin Ave NE, Grand Rapids, MI 49505 and is currently estimated at $281,112, approximately $165 per square foot. 1799 Benjamin Ave NE is a home located in Kent County with nearby schools including Riverside Middle School, Union High School, and Lighthouse Academy - Waalkes Campus.
Ownership History
Date
Name
Owned For
Owner Type
Purchase Details
Closed on
Jun 12, 2024
Sold by
Campbell Diane L
Bought by
Campbell L L and Campbell Diane L
Current Estimated Value
Purchase Details
Closed on
Jun 6, 2008
Sold by
Zerai Elsabeth and Bekru Michael
Bought by
Campbell Diane L
Home Financials for this Owner
Home Financials are based on the most recent Mortgage that was taken out on this home.
Original Mortgage
$90,200
Interest Rate
6.04%
Mortgage Type
Purchase Money Mortgage
Purchase Details
Closed on
Apr 6, 2004
Sold by
Bergmanis Richard
Bought by
Bekru Michael and Zerai Elsabeth
Home Financials for this Owner
Home Financials are based on the most recent Mortgage that was taken out on this home.
Original Mortgage
$92,150
Interest Rate
4%
Mortgage Type
Purchase Money Mortgage
Purchase Details
Closed on
Jul 9, 1969
Sold by
Bergmanis Antonia
Bought by
Bergmanis Richard and Campbell Diane L
Create a Home Valuation Report for This Property
The Home Valuation Report is an in-depth analysis detailing your home's value as well as a comparison with similar homes in the area
Home Values in the Area
Average Home Value in this Area
Purchase History
| Date | Buyer | Sale Price | Title Company |
|---|---|---|---|
| Campbell L L | -- | None Listed On Document | |
| Campbell Diane L | $93,100 | None Available | |
| Bekru Michael | $97,000 | Metropolitan Title Company | |
| Bergmanis Richard | -- | -- | |
| Bergmanis Richard | -- | -- |
Source: Public Records
Mortgage History
| Date | Status | Borrower | Loan Amount |
|---|---|---|---|
| Previous Owner | Campbell Diane L | $90,200 | |
| Previous Owner | Bekru Michael | $92,150 |
Source: Public Records
Tax History Compared to Growth
Tax History
| Year | Tax Paid | Tax Assessment Tax Assessment Total Assessment is a certain percentage of the fair market value that is determined by local assessors to be the total taxable value of land and additions on the property. | Land | Improvement |
|---|---|---|---|---|
| 2025 | $1,789 | $110,900 | $0 | $0 |
| 2024 | $1,789 | $102,400 | $0 | $0 |
| 2023 | $1,713 | $87,900 | $0 | $0 |
| 2022 | $1,723 | $76,200 | $0 | $0 |
| 2021 | $1,685 | $71,500 | $0 | $0 |
| 2020 | $1,611 | $67,000 | $0 | $0 |
| 2019 | $1,687 | $60,000 | $0 | $0 |
| 2018 | $1,629 | $54,800 | $0 | $0 |
| 2017 | $1,586 | $52,400 | $0 | $0 |
| 2016 | $1,605 | $47,100 | $0 | $0 |
| 2015 | $1,493 | $47,100 | $0 | $0 |
| 2013 | -- | $45,300 | $0 | $0 |
Source: Public Records
Map
Nearby Homes
- 1237 Dale Ct NE
- 1119 Kentwood Dr NE
- 1824 Herrick Ave NE
- 1666 Carlton Ave NE
- 1335 Knapp St NE
- 2027 Joan Ave NE
- 1444 Sweet St NE
- 2100 Dawson Ave NE
- 1524 Sweet St NE
- 1452 Carlton Ave NE
- 1848 Emerald Ave NE
- 1119 Spencer St NE
- 1455 Ball Ave NE
- 1339 Fuller Ave NE
- 1825 Meadowfield Dr NE
- 1757 Westlane Dr NE
- 1238 Carlton Ave NE
- 921 Eleanor St NE
- 1250 Mayfield Ave NE
- 1256 Diamond Ave NE
- 1807 Benjamin Ave NE
- 1785 Benjamin Ave NE
- 1815 Benjamin Ave NE
- 1754 Auburn Ave NE
- 1773 Benjamin Ave NE
- 1746 Auburn Ave NE
- 1796 Benjamin Ave NE
- 1765 Benjamin Ave NE
- 1806 Benjamin Ave NE
- 1786 Benjamin Ave NE
- 1814 Benjamin Ave NE
- 1774 Benjamin Ave NE
- 1738 Auburn Ave NE
- 1335 Dean St NE
- 1768 Benjamin Ave NE
- 1245 Drexel Ct NE
- 1345 Dean St NE
- 1831 Benjamin Ave NE
- 1732 Auburn Ave NE
- 1743 Benjamin Ave NE