Estimated Value: $160,000 - $181,000
3
Beds
1
Bath
1,168
Sq Ft
$145/Sq Ft
Est. Value
About This Home
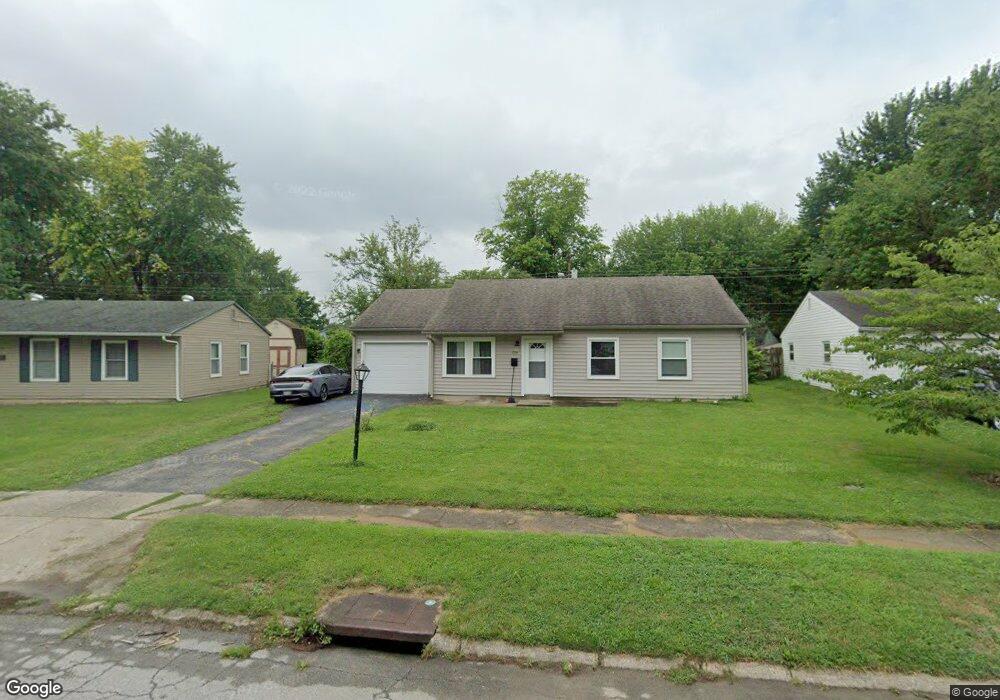
This home is located at 1799 Kylemore Dr, Xenia, OH 45385 and is currently estimated at $169,554, approximately $145 per square foot. 1799 Kylemore Dr is a home located in Greene County with nearby schools including Xenia High School, Summit Academy Community School for Alternative Learners - Xenia, and Legacy Christian Academy.
Ownership History
Date
Name
Owned For
Owner Type
Purchase Details
Closed on
Oct 18, 2019
Sold by
Slone Justin D
Bought by
Nolan Jacob A
Current Estimated Value
Home Financials for this Owner
Home Financials are based on the most recent Mortgage that was taken out on this home.
Original Mortgage
$101,134
Outstanding Balance
$92,044
Interest Rate
5.62%
Mortgage Type
FHA
Estimated Equity
$77,510
Purchase Details
Closed on
Jan 4, 2019
Sold by
Issac Charles
Bought by
Stone Justin D
Purchase Details
Closed on
Jun 12, 2012
Sold by
Isaac Diana
Bought by
Isaac Hiram
Purchase Details
Closed on
Sep 18, 2008
Sold by
Newcomer Rosemary and Newcomer David L
Bought by
Isaac Hiram and Isaac Diana
Home Financials for this Owner
Home Financials are based on the most recent Mortgage that was taken out on this home.
Original Mortgage
$75,119
Interest Rate
6.57%
Mortgage Type
FHA
Purchase Details
Closed on
Feb 19, 2000
Sold by
Walters Mark A
Bought by
Hammond Angela A and Walters Angela A
Create a Home Valuation Report for This Property
The Home Valuation Report is an in-depth analysis detailing your home's value as well as a comparison with similar homes in the area
Home Values in the Area
Average Home Value in this Area
Purchase History
| Date | Buyer | Sale Price | Title Company |
|---|---|---|---|
| Nolan Jacob A | $103,000 | None Available | |
| Stone Justin D | $46,460 | Sojourners Title Agency | |
| Isaac Hiram | -- | None Available | |
| Isaac Hiram | $75,900 | Attorney | |
| Hammond Angela A | -- | -- |
Source: Public Records
Mortgage History
| Date | Status | Borrower | Loan Amount |
|---|---|---|---|
| Open | Nolan Jacob A | $101,134 | |
| Previous Owner | Isaac Hiram | $75,119 |
Source: Public Records
Tax History Compared to Growth
Tax History
| Year | Tax Paid | Tax Assessment Tax Assessment Total Assessment is a certain percentage of the fair market value that is determined by local assessors to be the total taxable value of land and additions on the property. | Land | Improvement |
|---|---|---|---|---|
| 2024 | $1,865 | $43,580 | $9,780 | $33,800 |
| 2023 | $1,865 | $43,580 | $9,780 | $33,800 |
| 2022 | $1,521 | $30,320 | $6,990 | $23,330 |
| 2021 | $1,542 | $30,320 | $6,990 | $23,330 |
| 2020 | $1,477 | $30,320 | $6,990 | $23,330 |
| 2019 | $1,182 | $22,840 | $4,700 | $18,140 |
| 2018 | $713 | $22,840 | $4,700 | $18,140 |
| 2017 | $638 | $22,840 | $4,700 | $18,140 |
| 2016 | $639 | $21,150 | $4,700 | $16,450 |
| 2015 | $641 | $21,150 | $4,700 | $16,450 |
| 2014 | $613 | $21,150 | $4,700 | $16,450 |
Source: Public Records
Map
Nearby Homes
- 1568 Cheyenne Dr
- 121 S Progress Dr
- 1144 Rockwell Dr
- 1342 Kylemore Dr
- 1391 June Dr
- 1618 Navajo Dr
- 1653 Seneca Dr
- 1283 June Dr
- 1233 June Dr
- 1223 June Dr
- 2758 Wyoming Dr
- 1778 Arapaho Dr
- 219 Kansas Dr
- 1208 Bellbrook Ave
- 1272 Bellbrook Ave
- 1351 Omard Dr
- 1769 Gayhart Dr
- 343 Sheelin Rd
- 414 Whisper Ln
- 1829 Gayhart Dr
- 1811 Kylemore Dr
- 1787 Kylemore Dr
- 1840 Drake Dr
- 1856 Drake Dr
- 1823 Kylemore Dr
- 1826 Drake Dr
- 1777 Kylemore Dr
- 1870 Drake Dr
- 1802 Kylemore Dr
- 1784 Kylemore Dr
- 1810 Drake Dr
- 1816 Kylemore Dr
- 1882 Drake Dr
- 1837 Kylemore Dr
- 1765 Kylemore Dr
- 1766 Kylemore Dr
- 1828 Kylemore Dr
- 1794 Drake Dr
- 1896 Drake Dr
- 1849 Kylemore Dr