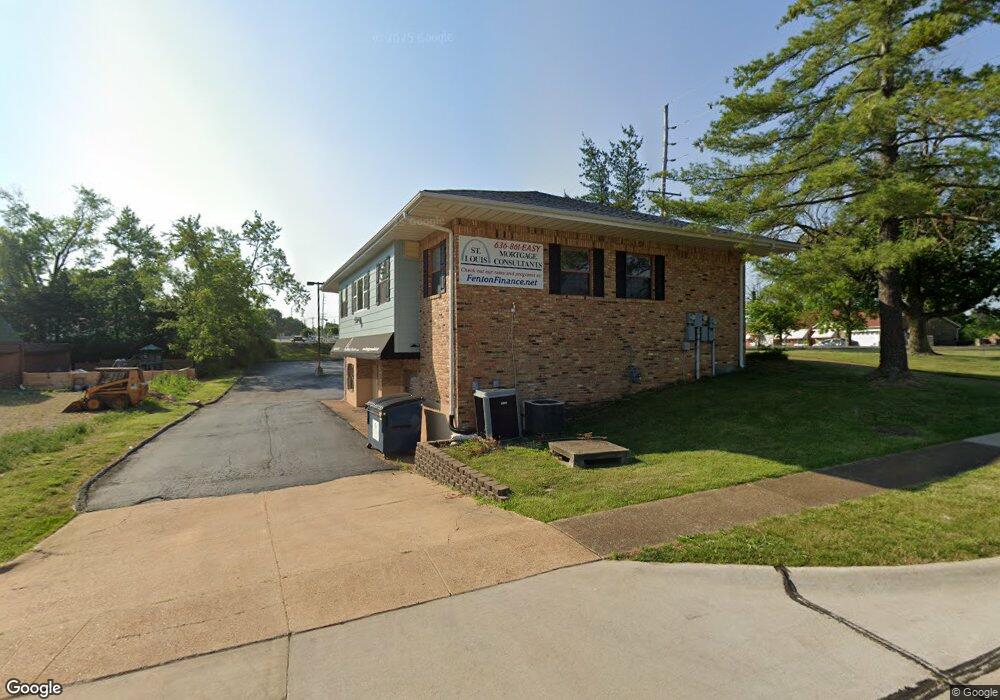
1799 Smizer Station Rd Fenton, MO 63026
Estimated Value: $853,000
--
Bed
--
Bath
4,012
Sq Ft
$213/Sq Ft
Est. Value
About This Home
This home is located at 1799 Smizer Station Rd, Fenton, MO 63026 and is currently estimated at $853,000, approximately $212 per square foot. 1799 Smizer Station Rd is a home located in St. Louis County with nearby schools including Uthoff Valley Elementary School, Rockwood South Middle School, and Rockwood Summit Senior High School.
Ownership History
Date
Name
Owned For
Owner Type
Purchase Details
Closed on
Dec 11, 2015
Sold by
Berwin David C and Berwin Nancy J
Bought by
Woolverton Terry S
Current Estimated Value
Home Financials for this Owner
Home Financials are based on the most recent Mortgage that was taken out on this home.
Original Mortgage
$35,360
Interest Rate
3.79%
Mortgage Type
Commercial
Purchase Details
Closed on
Sep 5, 2007
Sold by
Wang James and Chen Elina
Bought by
Gaona Jeffrey and Kraus Michael
Home Financials for this Owner
Home Financials are based on the most recent Mortgage that was taken out on this home.
Original Mortgage
$455,000
Interest Rate
6.72%
Mortgage Type
Commercial
Purchase Details
Closed on
Feb 26, 2004
Sold by
Burd Melissa
Bought by
Wang James and Chen Elina
Home Financials for this Owner
Home Financials are based on the most recent Mortgage that was taken out on this home.
Original Mortgage
$316,000
Interest Rate
5.68%
Mortgage Type
Commercial
Create a Home Valuation Report for This Property
The Home Valuation Report is an in-depth analysis detailing your home's value as well as a comparison with similar homes in the area
Home Values in the Area
Average Home Value in this Area
Purchase History
| Date | Buyer | Sale Price | Title Company |
|---|---|---|---|
| Woolverton Terry S | -- | Continental Title Company E | |
| Gaona Jeffrey | $455,000 | Tri | |
| Wang James | $395,000 | -- |
Source: Public Records
Mortgage History
| Date | Status | Borrower | Loan Amount |
|---|---|---|---|
| Closed | Woolverton Terry S | $35,360 | |
| Previous Owner | Gaona Jeffrey | $455,000 | |
| Previous Owner | Wang James | $316,000 |
Source: Public Records
Tax History Compared to Growth
Tax History
| Year | Tax Paid | Tax Assessment Tax Assessment Total Assessment is a certain percentage of the fair market value that is determined by local assessors to be the total taxable value of land and additions on the property. | Land | Improvement |
|---|---|---|---|---|
| 2025 | $14,986 | $179,840 | $66,240 | $113,600 |
| 2024 | $14,986 | $161,020 | $52,990 | $108,030 |
| 2023 | $14,986 | $161,020 | $52,990 | $108,030 |
| 2022 | $8,924 | $90,690 | $52,990 | $37,700 |
| 2021 | $8,825 | $90,690 | $52,990 | $37,700 |
| 2020 | $10,438 | $105,060 | $33,120 | $71,940 |
| 2019 | $10,482 | $105,060 | $33,120 | $71,940 |
| 2018 | $10,883 | $105,700 | $33,120 | $72,580 |
Source: Public Records
Map
Nearby Homes
- 2017 Brutus Ct
- 1719 Chestnut Farms Ct
- 1823 Dover Trace Dr
- 1655 Valley Park Rd
- 1808 Dover Trace Dr
- 1851 Hawkins Place
- 1818 Charles Thomas Ln
- 1923 Smizer Mill Rd
- 161 Majestic Dr
- 2 Salvation Ridge Ct
- 1800 Harbor Mill Dr
- 107 Majestic Dr
- 1107 Coronita Way
- 1881 San Pedro Ln
- 1883 San Lucas Ln
- 678 Greensleeves Dr
- 683 Greenholme Ct
- 1369 Green Birch Ct
- 1221 Newport Landing Dr
- 1401 Windrider Ct
- 17191725 Smizer Station Rd
- 2225 Apollo Dr
- 1751 Smizer Station Rd
- 2233 Bentley Manor Dr
- 1762 Smizer Station Rd
- 2231 Bentley Manor Dr
- 1805 Smizer Station Rd
- 2216 Apollo Dr
- 2229 Bentley Manor Dr
- 2227 Bentley Manor Dr
- 2214 Apollo Dr
- 2226 Bentley Manor Dr
- 2224 Bentley Manor Dr
- 2222 Bentley Manor Dr
- 2212 Apollo Dr
- 2225 Bentley Manor Dr
- 2217 Apollo Dr
- 1725 Smizer Station Rd
- 2220 Bentley Manor Dr
- 2210 Apollo Dr