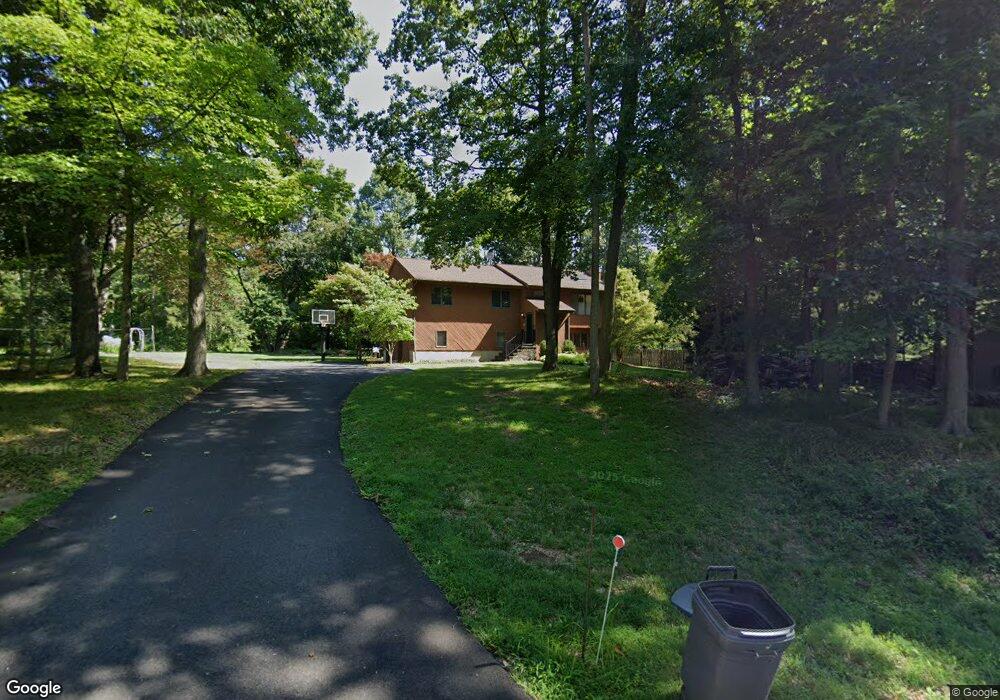
17A W Main St High Bridge, NJ 08829
Estimated Value: $478,556 - $625,000
--
Bed
--
Bath
1,968
Sq Ft
$283/Sq Ft
Est. Value
About This Home
This home is located at 17A W Main St, High Bridge, NJ 08829 and is currently estimated at $556,389, approximately $282 per square foot. 17A W Main St is a home located in Hunterdon County with nearby schools including High Bridge Elementary School, High Bridge Middle School, and Voorhees High School.
Ownership History
Date
Name
Owned For
Owner Type
Purchase Details
Closed on
Jun 28, 2004
Sold by
Wanamaker Gary R and Wanamaker Debra S
Bought by
Estrella Michael B and Estrella Sheri L
Current Estimated Value
Home Financials for this Owner
Home Financials are based on the most recent Mortgage that was taken out on this home.
Original Mortgage
$46,350
Interest Rate
6.3%
Mortgage Type
Credit Line Revolving
Purchase Details
Closed on
Jul 16, 1991
Sold by
Visser Nicholas K and Visser Nancy E
Bought by
Wanamaker Gary R and Wanamaker Debra S
Create a Home Valuation Report for This Property
The Home Valuation Report is an in-depth analysis detailing your home's value as well as a comparison with similar homes in the area
Home Values in the Area
Average Home Value in this Area
Purchase History
| Date | Buyer | Sale Price | Title Company |
|---|---|---|---|
| Estrella Michael B | $309,000 | Lawyers Title Ins | |
| Wanamaker Gary R | $180,000 | -- |
Source: Public Records
Mortgage History
| Date | Status | Borrower | Loan Amount |
|---|---|---|---|
| Closed | Estrella Michael B | $46,350 | |
| Open | Estrella Michael B | $247,200 |
Source: Public Records
Tax History Compared to Growth
Tax History
| Year | Tax Paid | Tax Assessment Tax Assessment Total Assessment is a certain percentage of the fair market value that is determined by local assessors to be the total taxable value of land and additions on the property. | Land | Improvement |
|---|---|---|---|---|
| 2025 | $11,280 | $349,400 | $144,500 | $204,900 |
| 2024 | $8,893 | $345,600 | $136,400 | $209,200 |
| 2023 | $8,893 | $224,900 | $83,600 | $141,300 |
| 2022 | $9,608 | $225,800 | $83,600 | $142,200 |
| 2021 | $9,423 | $226,300 | $83,600 | $142,700 |
| 2020 | $9,315 | $227,200 | $83,600 | $143,600 |
| 2019 | $9,423 | $228,100 | $83,600 | $144,500 |
| 2018 | $9,075 | $229,000 | $83,600 | $145,400 |
| 2017 | $8,934 | $231,800 | $83,600 | $148,200 |
| 2016 | $8,829 | $231,800 | $83,600 | $148,200 |
| 2015 | $8,591 | $231,800 | $83,600 | $148,200 |
| 2014 | $10,441 | $304,500 | $130,800 | $173,700 |
Source: Public Records
Map
Nearby Homes