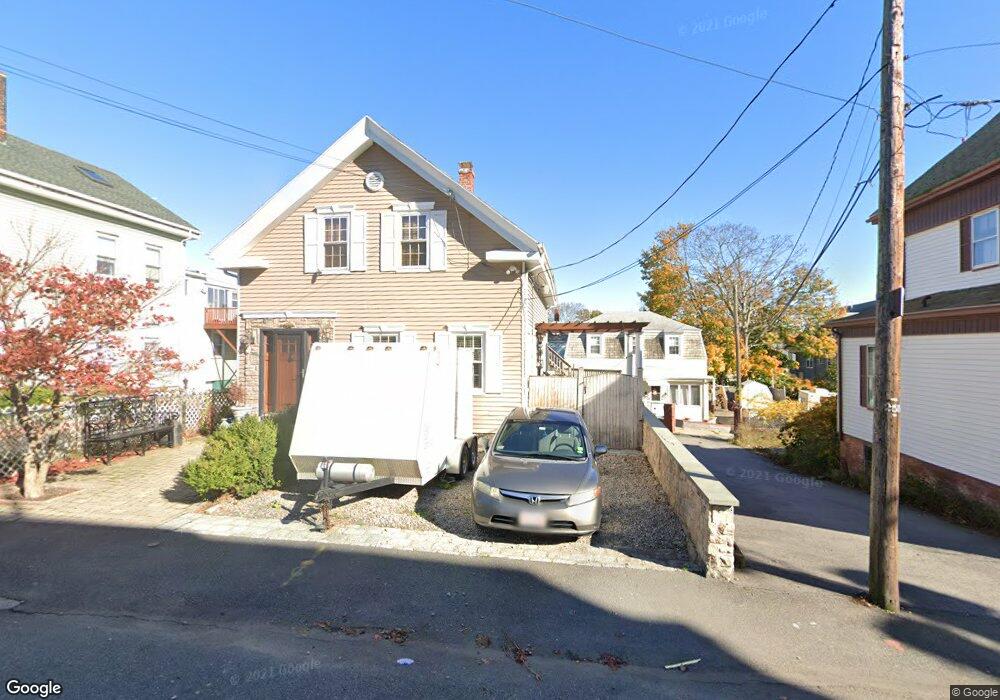
17R Elm St Gloucester, MA 01930
Central Gloucester NeighborhoodEstimated Value: $566,000 - $641,098
4
Beds
3
Baths
1,192
Sq Ft
$505/Sq Ft
Est. Value
About This Home
This home is located at 17R Elm St, Gloucester, MA 01930 and is currently estimated at $602,275, approximately $505 per square foot. 17R Elm St is a home located in Essex County with nearby schools including East Gloucester Elementary School, Ralph B O'maley Middle School, and Gloucester High School.
Ownership History
Date
Name
Owned For
Owner Type
Purchase Details
Closed on
Jul 24, 2023
Sold by
17 Rear Elm St Llc
Bought by
17R Elm Street Nt and Harrison
Current Estimated Value
Home Financials for this Owner
Home Financials are based on the most recent Mortgage that was taken out on this home.
Original Mortgage
$300,000
Outstanding Balance
$292,436
Interest Rate
6.71%
Mortgage Type
Purchase Money Mortgage
Estimated Equity
$309,839
Purchase Details
Closed on
Sep 19, 2022
Sold by
17A Elm Street T and Becker
Bought by
17 Rear Elm St Llc
Home Financials for this Owner
Home Financials are based on the most recent Mortgage that was taken out on this home.
Original Mortgage
$258,300
Interest Rate
5.22%
Mortgage Type
Construction
Purchase Details
Closed on
Nov 16, 1981
Bought by
Muise John B
Create a Home Valuation Report for This Property
The Home Valuation Report is an in-depth analysis detailing your home's value as well as a comparison with similar homes in the area
Home Values in the Area
Average Home Value in this Area
Purchase History
| Date | Buyer | Sale Price | Title Company |
|---|---|---|---|
| 17R Elm Street Nt | $575,000 | None Available | |
| 17 Rear Elm St Llc | -- | None Available | |
| 17 Rear Elm St Llc | -- | None Available | |
| Muise John B | -- | -- |
Source: Public Records
Mortgage History
| Date | Status | Borrower | Loan Amount |
|---|---|---|---|
| Open | 17R Elm Street Nt | $300,000 | |
| Previous Owner | 17 Rear Elm St Llc | $258,300 |
Source: Public Records
Tax History
| Year | Tax Paid | Tax Assessment Tax Assessment Total Assessment is a certain percentage of the fair market value that is determined by local assessors to be the total taxable value of land and additions on the property. | Land | Improvement |
|---|---|---|---|---|
| 2025 | $4,967 | $511,000 | $117,600 | $393,400 |
| 2024 | $2,069 | $212,600 | $112,000 | $100,600 |
| 2023 | $2,914 | $275,200 | $99,700 | $175,500 |
| 2022 | $2,816 | $240,100 | $86,700 | $153,400 |
| 2021 | $2,716 | $218,300 | $78,800 | $139,500 |
| 2020 | $2,655 | $215,300 | $78,800 | $136,500 |
| 2019 | $2,514 | $198,100 | $78,800 | $119,300 |
| 2018 | $2,404 | $185,900 | $78,800 | $107,100 |
| 2017 | $2,275 | $172,500 | $71,000 | $101,500 |
| 2016 | $2,175 | $159,800 | $70,900 | $88,900 |
| 2015 | $2,087 | $152,900 | $70,900 | $82,000 |
Source: Public Records
Map
Nearby Homes
- 191 Main St Unit 3
- 191 Main St Unit 2A
- 139A Prospect St
- 113 Pleasant St
- 35 Middle St Unit 4
- 33 Middle St
- 33 Maplewood Ave Unit 310
- 50 Warner St
- 19 Trask St Unit 2
- 40 Sargent St
- 120 Washington St
- 60 Rocky Neck Ave Unit 202
- 12 Arthur St
- 9 Cleveland Place
- 20 Beacon St
- 20 Beacon St Unit 2
- 20 Beacon St Unit 1
- 73 Rocky Neck Ave Unit 2
- 197 E Main St Unit 1
- 98 Maplewood Ave
- 15 Elm St
- 15R Elm St
- 10 Chestnut St
- 17 Elm St
- 19 Elm St
- 12 Chestnut St
- 21 Elm St
- 6 Chestnut St
- 6 Chestnut St Unit 4
- 6 Chestnut St Unit 3
- 6 Chestnut St Unit 1
- 6 Chestnut St Unit 2
- 14 Chestnut St
- 23R Elm St
- 13 Chestnut St
- 13 Chestnut St Unit 1
- 13 Chestnut St Unit 2
- 9 Chestnut St
- 23 Elm St
- 10 Federal St
Your Personal Tour Guide
Ask me questions while you tour the home.