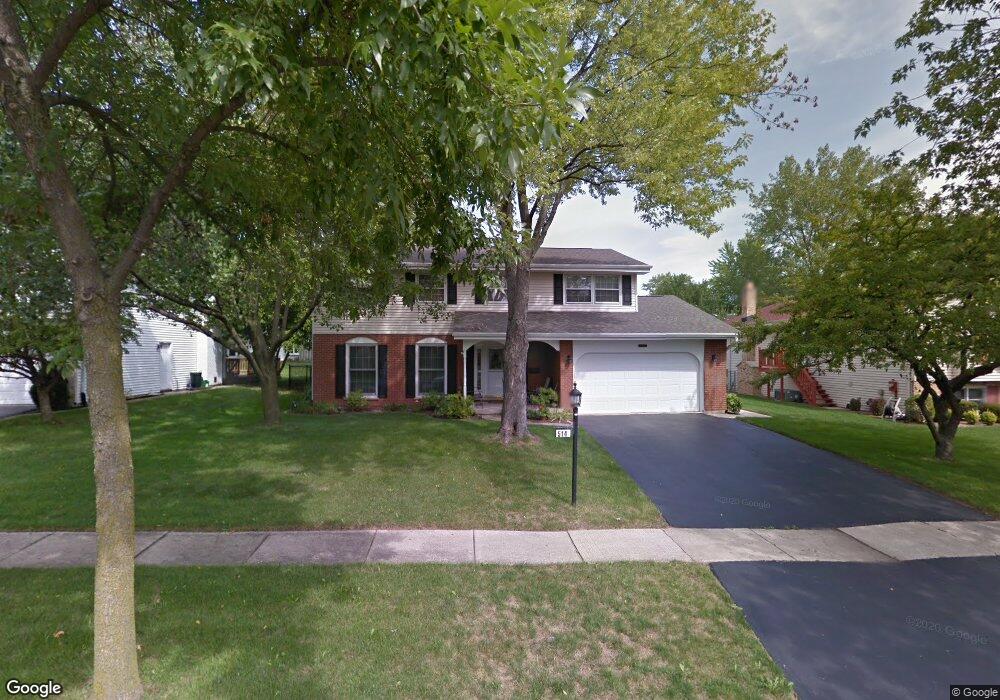
17W514 Concord Place Darien, IL 60561
Estimated Value: $475,751 - $527,000
4
Beds
3
Baths
2,288
Sq Ft
$221/Sq Ft
Est. Value
About This Home
This home is located at 17W514 Concord Place, Darien, IL 60561 and is currently estimated at $504,938, approximately $220 per square foot. 17W514 Concord Place is a home located in DuPage County with nearby schools including Concord Elementary School, Cass Jr High School, and Hinsdale South High School.
Ownership History
Date
Name
Owned For
Owner Type
Purchase Details
Closed on
Jul 21, 2017
Sold by
Crowther Brian W and Crowther Jennifer G
Bought by
Franczky Michael E and Franczky Katie M
Current Estimated Value
Home Financials for this Owner
Home Financials are based on the most recent Mortgage that was taken out on this home.
Original Mortgage
$346,750
Outstanding Balance
$288,170
Interest Rate
3.9%
Mortgage Type
New Conventional
Estimated Equity
$216,768
Purchase Details
Closed on
Oct 26, 2015
Sold by
Crowther Judith
Bought by
Crowther Brian W and Crowther Jennifer G
Home Financials for this Owner
Home Financials are based on the most recent Mortgage that was taken out on this home.
Original Mortgage
$318,000
Interest Rate
3.82%
Mortgage Type
New Conventional
Purchase Details
Closed on
Aug 25, 2000
Sold by
Crowther William J
Bought by
Crowther Judith M
Create a Home Valuation Report for This Property
The Home Valuation Report is an in-depth analysis detailing your home's value as well as a comparison with similar homes in the area
Home Values in the Area
Average Home Value in this Area
Purchase History
| Date | Buyer | Sale Price | Title Company |
|---|---|---|---|
| Franczky Michael E | $365,000 | First American Title | |
| Crowther Brian W | $340,000 | First American Title Company | |
| Crowther Judith M | -- | -- |
Source: Public Records
Mortgage History
| Date | Status | Borrower | Loan Amount |
|---|---|---|---|
| Open | Franczky Michael E | $346,750 | |
| Previous Owner | Crowther Brian W | $318,000 |
Source: Public Records
Tax History Compared to Growth
Tax History
| Year | Tax Paid | Tax Assessment Tax Assessment Total Assessment is a certain percentage of the fair market value that is determined by local assessors to be the total taxable value of land and additions on the property. | Land | Improvement |
|---|---|---|---|---|
| 2024 | $8,290 | $148,365 | $49,212 | $99,153 |
| 2023 | $7,973 | $136,390 | $45,240 | $91,150 |
| 2022 | $7,583 | $129,760 | $43,040 | $86,720 |
| 2021 | $6,981 | $128,280 | $42,550 | $85,730 |
| 2020 | $6,744 | $123,140 | $41,710 | $81,430 |
| 2019 | $6,506 | $118,150 | $40,020 | $78,130 |
| 2018 | $6,022 | $112,960 | $39,800 | $73,160 |
| 2017 | $5,953 | $108,700 | $38,300 | $70,400 |
| 2016 | $5,784 | $103,740 | $36,550 | $67,190 |
| 2015 | $5,669 | $97,600 | $34,390 | $63,210 |
| 2014 | $5,567 | $94,900 | $33,440 | $61,460 |
| 2013 | $5,346 | $94,450 | $33,280 | $61,170 |
Source: Public Records
Map
Nearby Homes
- 17W455 Concord Place
- Lot 1, 2, 3, 4 & 5 Nantucket Dr
- 801 79th St Unit 105
- 709 79th St Unit 103
- 709 79th St Unit 307
- 709 79th St Unit 403
- 1018 Bob-O-link Ln
- 7817 Mayfair Ln
- 716 Somerset Ln
- 7713 Brookhaven Ave
- 8122 Ripple Ridge
- 7715 Sussex Creek Dr Unit 1D
- 8408 Dawn Ln
- 1310 Iroquois Ln
- 7930 Grant St
- 8081 Tennessee Ave
- 8301 Highpoint Cir Unit C
- 7515 Nantucket Dr Unit 404
- 7525 Nantucket Dr Unit 210
- 8320 Highpoint Cir Unit 8230-F
- 17W514 Concord Place
- 17W524 Concord Place Unit 1
- 17W504 Concord Place
- 17W515 Earl Ct
- 17W515 Concord Place
- 17W505 Concord Place
- 17W525 Concord Place
- 17W484 Concord Place Unit 1
- 17W534 Concord Place
- 17W505 Earl Ct
- 17W525 Earl Ct
- 17W485 Concord Place
- 17W535 Earl Ct
- 17W474 Concord Place
- 17W485 Earl Ct
- 17W475 Concord Place
- 17W544 Concord Place
- 17W535 Concord Place
- 17W545 Earl Ct
- 17W475 Earl Ct