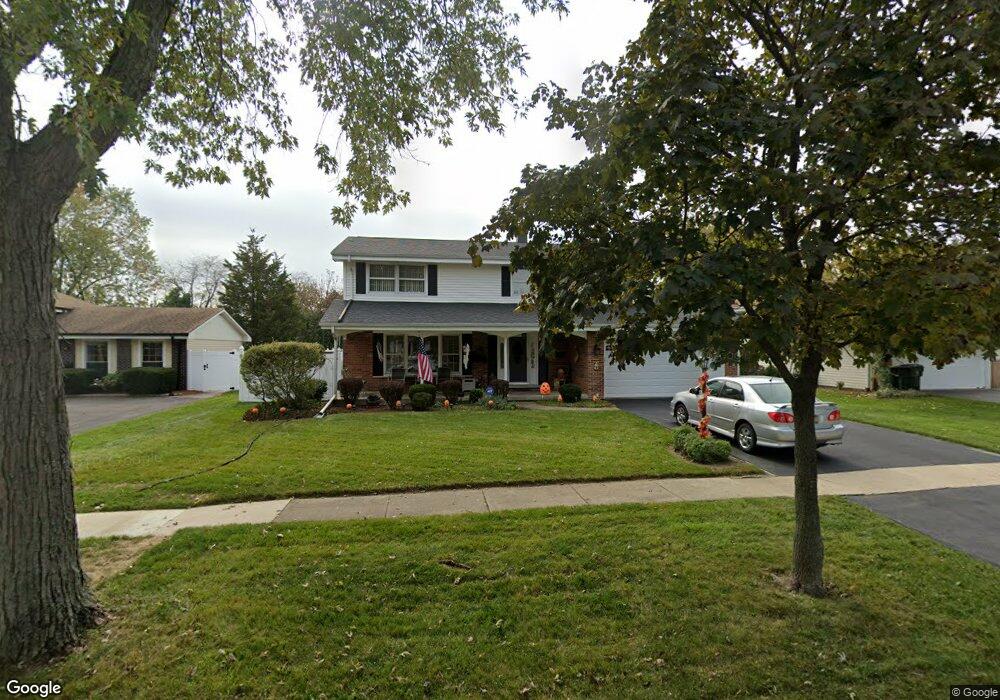
17W555 Earl Ct Unit 1 Darien, IL 60561
Estimated Value: $478,018 - $531,000
--
Bed
1
Bath
2,288
Sq Ft
$223/Sq Ft
Est. Value
About This Home
This home is located at 17W555 Earl Ct Unit 1, Darien, IL 60561 and is currently estimated at $510,755, approximately $223 per square foot. 17W555 Earl Ct Unit 1 is a home located in DuPage County with nearby schools including Concord Elementary School, Cass Jr High School, and Hinsdale South High School.
Ownership History
Date
Name
Owned For
Owner Type
Purchase Details
Closed on
Jun 23, 2003
Sold by
Koenen Margaret A
Bought by
Collins Gerald and Collins Roxane
Current Estimated Value
Home Financials for this Owner
Home Financials are based on the most recent Mortgage that was taken out on this home.
Original Mortgage
$242,400
Outstanding Balance
$104,100
Interest Rate
5.51%
Mortgage Type
Purchase Money Mortgage
Estimated Equity
$406,655
Purchase Details
Closed on
May 20, 1997
Sold by
Koenen Margaret A
Bought by
Koenen Margaret A and Margaret A Koenen Trust
Purchase Details
Closed on
Nov 15, 1995
Sold by
Koenen Francis J and Koenen Margaret A
Bought by
Koenen Francis J and Koenen Margaret A
Purchase Details
Closed on
Nov 14, 1995
Sold by
First National Bank Of Evergreen
Bought by
Koenen Francis J and Koenen Margaret A
Create a Home Valuation Report for This Property
The Home Valuation Report is an in-depth analysis detailing your home's value as well as a comparison with similar homes in the area
Home Values in the Area
Average Home Value in this Area
Purchase History
| Date | Buyer | Sale Price | Title Company |
|---|---|---|---|
| Collins Gerald | $303,000 | Chicago Title Insurance Comp | |
| Koenen Margaret A | -- | -- | |
| Koenen Francis J | -- | -- | |
| Koenen Francis J | -- | -- |
Source: Public Records
Mortgage History
| Date | Status | Borrower | Loan Amount |
|---|---|---|---|
| Open | Collins Gerald | $242,400 | |
| Closed | Collins Gerald | $60,600 |
Source: Public Records
Tax History Compared to Growth
Tax History
| Year | Tax Paid | Tax Assessment Tax Assessment Total Assessment is a certain percentage of the fair market value that is determined by local assessors to be the total taxable value of land and additions on the property. | Land | Improvement |
|---|---|---|---|---|
| 2024 | $8,413 | $150,127 | $49,212 | $100,915 |
| 2023 | $8,092 | $138,010 | $45,240 | $92,770 |
| 2022 | $7,696 | $131,300 | $43,040 | $88,260 |
| 2021 | $7,086 | $129,810 | $42,550 | $87,260 |
| 2020 | $6,981 | $127,240 | $41,710 | $85,530 |
| 2019 | $6,734 | $122,090 | $40,020 | $82,070 |
| 2018 | $6,305 | $117,980 | $39,800 | $78,180 |
| 2017 | $6,233 | $113,530 | $38,300 | $75,230 |
| 2016 | $6,056 | $108,350 | $36,550 | $71,800 |
| 2015 | $5,937 | $101,940 | $34,390 | $67,550 |
| 2014 | $5,831 | $99,120 | $33,440 | $65,680 |
| 2013 | $5,522 | $97,350 | $33,280 | $64,070 |
Source: Public Records
Map
Nearby Homes
- 17W455 Concord Place
- Lot 1, 2, 3, 4 & 5 Nantucket Dr
- 801 79th St Unit 105
- 709 79th St Unit 103
- 709 79th St Unit 307
- 709 79th St Unit 403
- 1018 Bob-O-link Ln
- 7817 Mayfair Ln
- 7713 Brookhaven Ave
- 716 Somerset Ln
- 7930 Grant St
- 1310 Iroquois Ln
- 8122 Ripple Ridge
- 7715 Sussex Creek Dr Unit 1D
- 8408 Dawn Ln
- 8081 Tennessee Ave
- 7515 Nantucket Dr Unit 404
- 7525 Nantucket Dr Unit 210
- 8301 Highpoint Cir Unit C
- 1390 Marco Ct
- 17W565 Earl Ct
- 17W545 Earl Ct
- 17W554 Concord Place
- 17W564 Concord Place
- 17W535 Earl Ct
- 17W544 Concord Place
- 17W544 Earl Ct
- 17W554 Earl Ct
- 17W534 Concord Place
- 17W564 Earl Ct
- 17W534 Earl Ct
- 9S070 Stratford Place
- 9S060 Stratford Place
- 17W525 Earl Ct
- 9S090 Stratford Place
- 9S050 Stratford Place
- 17W555 Sutton Place
- 17W565 Sutton Place
- 17W524 Earl Ct Unit 1
- 17W561 Concord Place