Estimated Value: $647,000 - $712,000
2
Beds
1
Bath
1,280
Sq Ft
$527/Sq Ft
Est. Value
About This Home
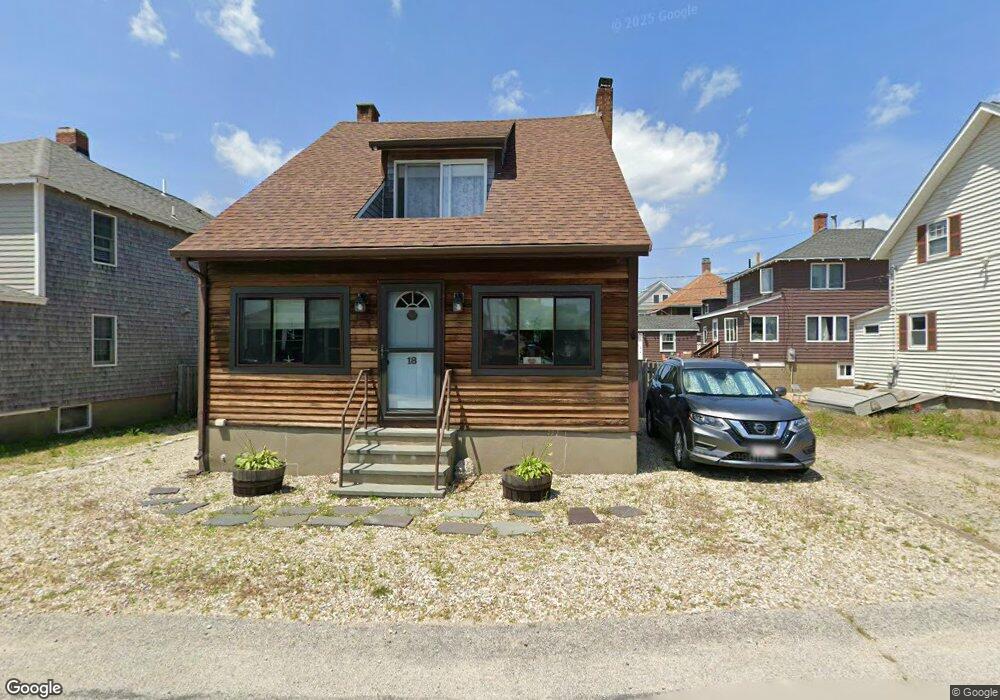
This home is located at 18 11th Rd, Marshfield, MA 02050 and is currently estimated at $674,961, approximately $527 per square foot. 18 11th Rd is a home with nearby schools including Daniel Webster, Furnace Brook Middle School, and Marshfield High School.
Ownership History
Date
Name
Owned For
Owner Type
Purchase Details
Closed on
Jun 17, 2014
Sold by
Dailey Mary A
Bought by
Mary Ann Dailey Irt and Dailey
Current Estimated Value
Purchase Details
Closed on
Mar 17, 2014
Sold by
Boone Ft and Decoste
Bought by
Dailey Mary A
Create a Home Valuation Report for This Property
The Home Valuation Report is an in-depth analysis detailing your home's value as well as a comparison with similar homes in the area
Home Values in the Area
Average Home Value in this Area
Purchase History
| Date | Buyer | Sale Price | Title Company |
|---|---|---|---|
| Mary Ann Dailey Irt | -- | -- | |
| Mary Ann Dailey Irt | -- | -- | |
| Dailey Mary A | $210,000 | -- |
Source: Public Records
Mortgage History
| Date | Status | Borrower | Loan Amount |
|---|---|---|---|
| Previous Owner | Mary Ann Dailey Irt | $43,000 | |
| Previous Owner | Mary Ann Dailey Irt | $18,000 |
Source: Public Records
Tax History Compared to Growth
Tax History
| Year | Tax Paid | Tax Assessment Tax Assessment Total Assessment is a certain percentage of the fair market value that is determined by local assessors to be the total taxable value of land and additions on the property. | Land | Improvement |
|---|---|---|---|---|
| 2025 | $6,364 | $642,800 | $428,400 | $214,400 |
| 2024 | $5,950 | $572,700 | $382,500 | $190,200 |
| 2023 | $5,743 | $506,700 | $346,800 | $159,900 |
| 2022 | $5,743 | $443,500 | $314,500 | $129,000 |
| 2021 | $5,772 | $437,600 | $314,500 | $123,100 |
| 2020 | $5,232 | $392,500 | $275,400 | $117,100 |
| 2019 | $5,173 | $386,600 | $275,400 | $111,200 |
| 2018 | $4,669 | $349,200 | $238,000 | $111,200 |
| 2017 | $4,683 | $341,300 | $238,000 | $103,300 |
| 2016 | $4,505 | $324,600 | $226,100 | $98,500 |
| 2015 | $4,314 | $324,600 | $226,100 | $98,500 |
| 2014 | $4,257 | $320,300 | $226,100 | $94,200 |
Source: Public Records
Map
Nearby Homes