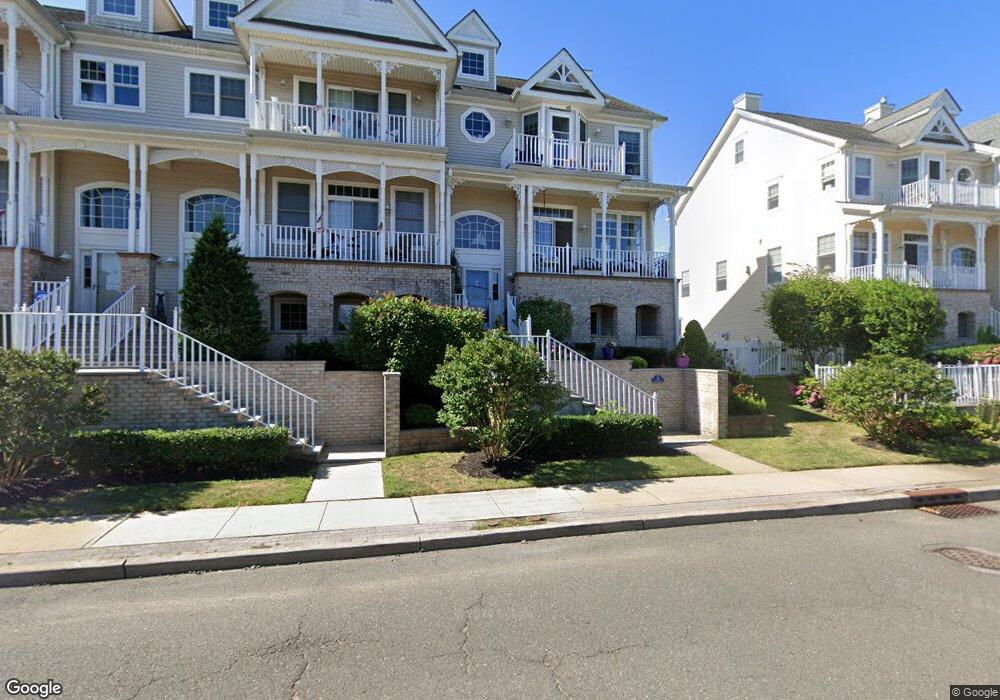
18 1st St Keyport, NJ 07735
Estimated Value: $620,000 - $773,000
2
Beds
3
Baths
2,409
Sq Ft
$300/Sq Ft
Est. Value
About This Home
This home is located at 18 1st St, Keyport, NJ 07735 and is currently estimated at $723,149, approximately $300 per square foot. 18 1st St is a home located in Monmouth County with nearby schools including Keyport Central School, Keyport High School, and Icob Academy.
Ownership History
Date
Name
Owned For
Owner Type
Purchase Details
Closed on
Jun 13, 2014
Sold by
Clark Jedediah and Charlesworth Meg
Bought by
Pontier Scott J and Pontier Meral E
Current Estimated Value
Home Financials for this Owner
Home Financials are based on the most recent Mortgage that was taken out on this home.
Original Mortgage
$348,000
Interest Rate
3.5%
Mortgage Type
Adjustable Rate Mortgage/ARM
Purchase Details
Closed on
Jul 10, 2003
Sold by
Knichel Dianne
Bought by
Long Erica
Home Financials for this Owner
Home Financials are based on the most recent Mortgage that was taken out on this home.
Original Mortgage
$152,112
Interest Rate
5.46%
Mortgage Type
FHA
Create a Home Valuation Report for This Property
The Home Valuation Report is an in-depth analysis detailing your home's value as well as a comparison with similar homes in the area
Home Values in the Area
Average Home Value in this Area
Purchase History
| Date | Buyer | Sale Price | Title Company |
|---|---|---|---|
| Pontier Scott J | $435,000 | None Available | |
| Pointier Scott J | $435,000 | Title Lines | |
| Long Erica | $154,500 | -- |
Source: Public Records
Mortgage History
| Date | Status | Borrower | Loan Amount |
|---|---|---|---|
| Previous Owner | Pointier Scott J | $348,000 | |
| Previous Owner | Long Erica | $152,112 |
Source: Public Records
Tax History Compared to Growth
Tax History
| Year | Tax Paid | Tax Assessment Tax Assessment Total Assessment is a certain percentage of the fair market value that is determined by local assessors to be the total taxable value of land and additions on the property. | Land | Improvement |
|---|---|---|---|---|
| 2025 | $14,331 | $676,400 | $239,200 | $437,200 |
| 2024 | $14,250 | $692,300 | $266,500 | $425,800 |
| 2023 | $14,250 | $648,300 | $242,200 | $406,100 |
| 2022 | $13,536 | $587,900 | $230,700 | $357,200 |
| 2021 | $13,536 | $536,300 | $213,600 | $322,700 |
| 2020 | $13,086 | $514,600 | $204,100 | $310,500 |
| 2019 | $12,743 | $501,900 | $195,100 | $306,800 |
| 2018 | $12,745 | $490,200 | $199,900 | $290,300 |
| 2017 | $13,267 | $508,900 | $190,400 | $318,500 |
| 2016 | $12,113 | $468,600 | $190,400 | $278,200 |
| 2015 | $11,287 | $434,600 | $157,100 | $277,500 |
| 2014 | $9,967 | $387,500 | $157,100 | $230,400 |
Source: Public Records
Map
Nearby Homes