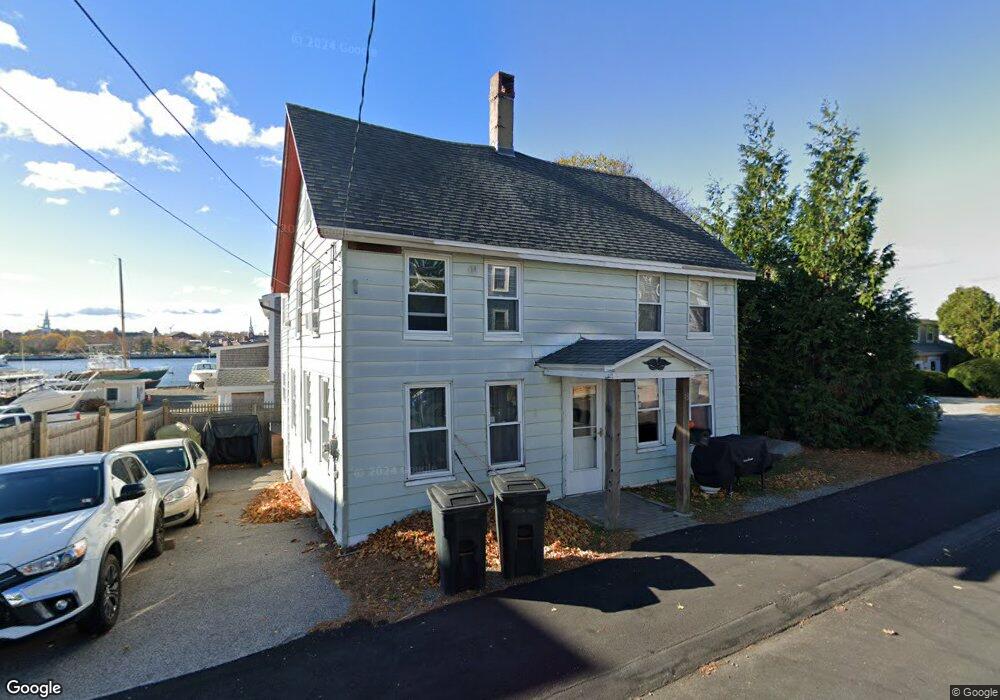
18 1st St Salisbury, MA 01952
Estimated Value: $603,000 - $798,000
4
Beds
2
Baths
1,424
Sq Ft
$508/Sq Ft
Est. Value
About This Home
This home is located at 18 1st St, Salisbury, MA 01952 and is currently estimated at $722,759, approximately $507 per square foot. 18 1st St is a home located in Essex County with nearby schools including Triton Regional High School, River Valley Charter School, and Immaculate Conception School.
Ownership History
Date
Name
Owned For
Owner Type
Purchase Details
Closed on
Oct 6, 2025
Sold by
Elwell Fred J
Bought by
Jing Llc
Current Estimated Value
Home Financials for this Owner
Home Financials are based on the most recent Mortgage that was taken out on this home.
Original Mortgage
$446,250
Outstanding Balance
$445,052
Interest Rate
6.58%
Mortgage Type
Purchase Money Mortgage
Estimated Equity
$277,707
Purchase Details
Closed on
Dec 16, 2021
Sold by
Elwell Fred J and Elwell Violet I
Bought by
Elwell Fred J
Home Financials for this Owner
Home Financials are based on the most recent Mortgage that was taken out on this home.
Original Mortgage
$160,000
Interest Rate
3.09%
Mortgage Type
New Conventional
Purchase Details
Closed on
Dec 26, 2006
Sold by
Knox Madelyn D
Bought by
Elwell Fred J
Home Financials for this Owner
Home Financials are based on the most recent Mortgage that was taken out on this home.
Original Mortgage
$100,000
Interest Rate
6.35%
Mortgage Type
Purchase Money Mortgage
Create a Home Valuation Report for This Property
The Home Valuation Report is an in-depth analysis detailing your home's value as well as a comparison with similar homes in the area
Home Values in the Area
Average Home Value in this Area
Purchase History
| Date | Buyer | Sale Price | Title Company |
|---|---|---|---|
| Jing Llc | $595,000 | -- | |
| Elwell Fred J | -- | None Available | |
| Elwell Fred J | -- | None Available | |
| Elwell Fred J | $300,000 | -- | |
| Elwell Fred J | $300,000 | -- |
Source: Public Records
Mortgage History
| Date | Status | Borrower | Loan Amount |
|---|---|---|---|
| Open | Jing Llc | $446,250 | |
| Previous Owner | Elwell Fred J | $160,000 | |
| Previous Owner | Elwell Fred J | $150,000 | |
| Previous Owner | Elwell Fred J | $100,000 | |
| Previous Owner | Elwell Fred J | $48,000 |
Source: Public Records
Tax History
| Year | Tax Paid | Tax Assessment Tax Assessment Total Assessment is a certain percentage of the fair market value that is determined by local assessors to be the total taxable value of land and additions on the property. | Land | Improvement |
|---|---|---|---|---|
| 2025 | $7,130 | $707,300 | $526,200 | $181,100 |
| 2024 | $6,620 | $633,500 | $462,000 | $171,500 |
| 2023 | $5,352 | $495,600 | $336,000 | $159,600 |
| 2022 | $4,668 | $419,000 | $277,200 | $141,800 |
| 2021 | $4,486 | $398,400 | $264,000 | $134,400 |
| 2020 | $4,483 | $391,200 | $264,000 | $127,200 |
| 2019 | $3,487 | $294,000 | $178,500 | $115,500 |
| 2018 | $4,091 | $347,300 | $232,000 | $115,300 |
| 2017 | $3,534 | $296,500 | $192,000 | $104,500 |
| 2016 | $3,558 | $304,900 | $200,400 | $104,500 |
| 2015 | $3,163 | $269,200 | $162,000 | $107,200 |
Source: Public Records
Map
Nearby Homes
- 175 Bridge Rd
- 157 Bridge Rd
- 2 Elbow Ln Unit A
- 10 10th St
- 14 Partridge Ln Unit C
- 102 Pleasant St Unit 102
- 7 Summer St Unit 7
- 14-18 Market St
- 11 Charter St
- 158 Merrimac St Unit 3
- 129 Merrimac St Unit 9
- 182 Merrimac St Unit 1
- 52 Fair St Unit 2D
- 1 Salem St Unit 2
- 105 State St Unit 101
- 105 State St Unit 301
- 105 State St Unit 201
- 45 Boardman St Unit 1
- 151 High St Unit 3B
- 215 Merrimac St Unit 2
Your Personal Tour Guide
Ask me questions while you tour the home.