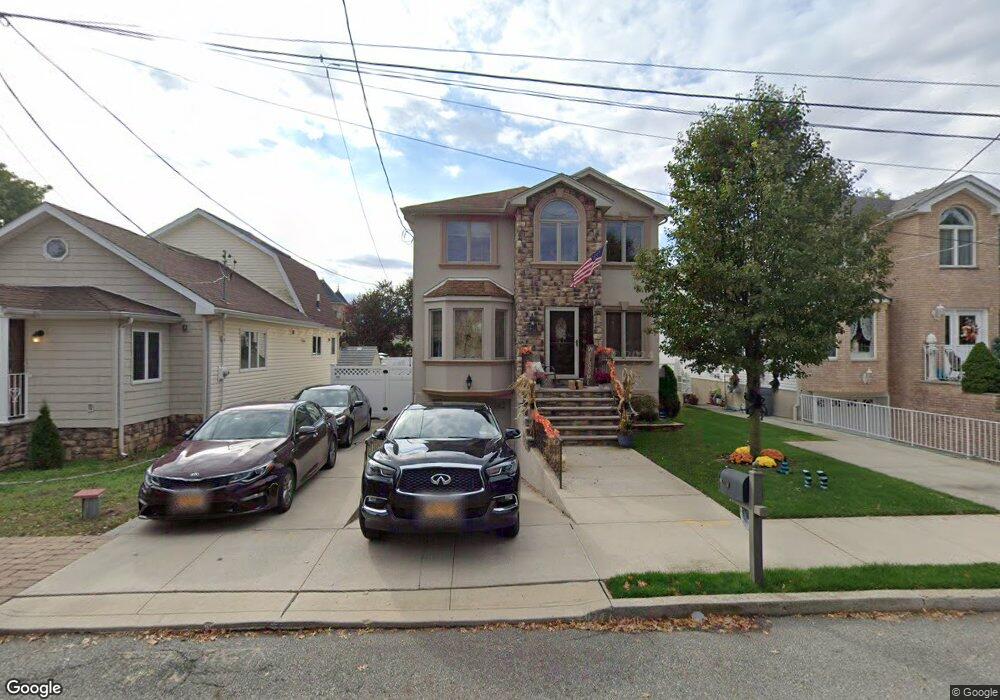
18-20 Sanford St Staten Island, NY 10307
Tottenville NeighborhoodEstimated Value: $1,038,000 - $1,213,000
--
Bed
--
Bath
2,997
Sq Ft
$375/Sq Ft
Est. Value
About This Home
This home is located at 18-20 Sanford St, Staten Island, NY 10307 and is currently estimated at $1,122,557, approximately $374 per square foot. 18-20 Sanford St is a home located in Richmond County with nearby schools including P.S. 6 Cpl Allan F Kivlehan School, Is 34 Tottenville, and Tottenville High School.
Ownership History
Date
Name
Owned For
Owner Type
Purchase Details
Closed on
Feb 5, 2009
Sold by
Brisaman Management Co Inc
Bought by
Orrico Joseph and Orrico Nicole A
Current Estimated Value
Home Financials for this Owner
Home Financials are based on the most recent Mortgage that was taken out on this home.
Original Mortgage
$525,000
Outstanding Balance
$329,711
Interest Rate
5.06%
Mortgage Type
Purchase Money Mortgage
Estimated Equity
$792,846
Purchase Details
Closed on
May 24, 2006
Sold by
Bessi Richard S and Bessi Christine M
Bought by
Brisaman Management Co Inc
Home Financials for this Owner
Home Financials are based on the most recent Mortgage that was taken out on this home.
Original Mortgage
$227,000
Interest Rate
6.7%
Mortgage Type
Stand Alone First
Purchase Details
Closed on
Aug 5, 1997
Sold by
Hyde Richard C
Bought by
Bessi Richard S and Bessi Christine M
Create a Home Valuation Report for This Property
The Home Valuation Report is an in-depth analysis detailing your home's value as well as a comparison with similar homes in the area
Home Values in the Area
Average Home Value in this Area
Purchase History
| Date | Buyer | Sale Price | Title Company |
|---|---|---|---|
| Orrico Joseph | $675,000 | None Available | |
| Brisaman Management Co Inc | $350,000 | None Available | |
| Bessi Richard S | $125,000 | -- |
Source: Public Records
Mortgage History
| Date | Status | Borrower | Loan Amount |
|---|---|---|---|
| Open | Orrico Joseph | $525,000 | |
| Previous Owner | Brisaman Management Co Inc | $227,000 |
Source: Public Records
Tax History Compared to Growth
Tax History
| Year | Tax Paid | Tax Assessment Tax Assessment Total Assessment is a certain percentage of the fair market value that is determined by local assessors to be the total taxable value of land and additions on the property. | Land | Improvement |
|---|---|---|---|---|
| 2025 | $10,454 | $71,580 | $8,879 | $62,701 |
| 2024 | $10,454 | $63,900 | $9,384 | $54,516 |
| 2023 | $9,973 | $49,104 | $8,988 | $40,116 |
| 2022 | $9,728 | $62,400 | $11,520 | $50,880 |
| 2021 | $10,255 | $57,120 | $11,520 | $45,600 |
| 2020 | $9,732 | $59,340 | $11,520 | $47,820 |
| 2019 | $9,074 | $52,380 | $11,520 | $40,860 |
| 2018 | $8,342 | $40,920 | $11,520 | $29,400 |
| 2017 | $8,278 | $40,608 | $10,966 | $29,642 |
| 2016 | $8,118 | $40,608 | $10,799 | $29,809 |
| 2015 | $6,286 | $39,370 | $9,250 | $30,120 |
| 2014 | $6,286 | $37,142 | $9,242 | $27,900 |
Source: Public Records
Map
Nearby Homes
- 18 Sanford St Unit 20
- 16 Sanford St
- 20 Sanford St
- 22 Sanford St
- 165 Nancy Ln
- 24 Sanford St
- 169 Nancy Ln
- 163 Nancy Ln
- 366 Brehaut Ave
- 360 Brehaut Ave
- 173 Nancy Ln
- 354 Brehaut Ave
- 25 Sanford St
- 370 Brehaut Ave
- 17 Sanford St
- 17 Sanford St
- 53 Sprague Ave
- 53 Sprague Ave Unit Ph
- 63 Sprague Ave
- 374 Brehaut Ave