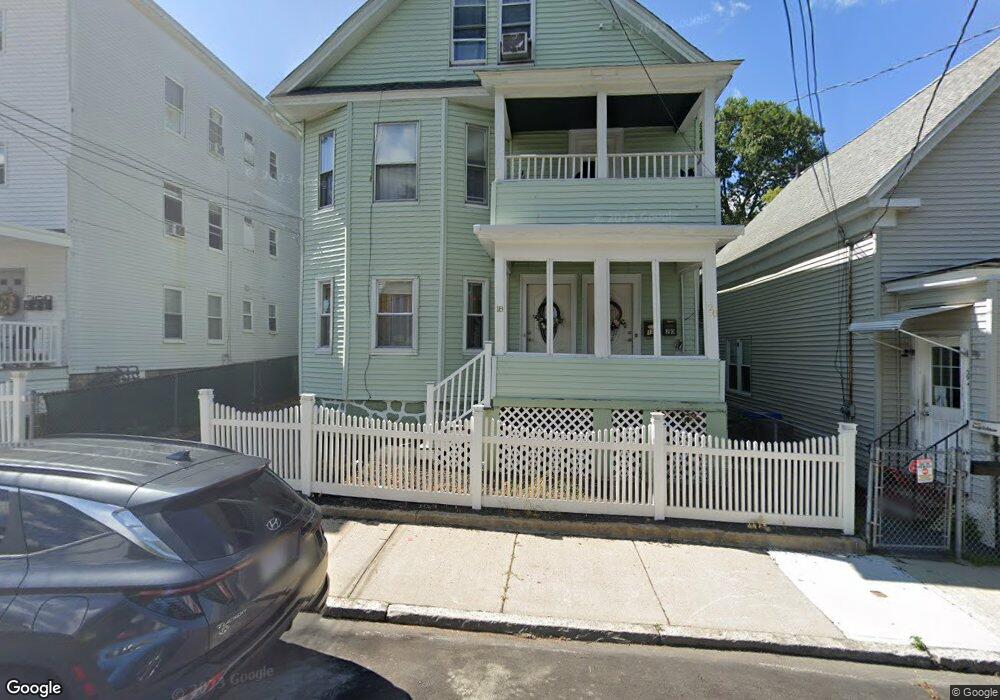
18-20 Union St Methuen, MA 01844
Downtown Methuen NeighborhoodEstimated Value: $659,000 - $694,382
6
Beds
2
Baths
2,438
Sq Ft
$275/Sq Ft
Est. Value
About This Home
This home is located at 18-20 Union St, Methuen, MA 01844 and is currently estimated at $671,346, approximately $275 per square foot. 18-20 Union St is a home located in Essex County with nearby schools including Marsh Grammar School, South Point Elementary School, and Methuen High School.
Ownership History
Date
Name
Owned For
Owner Type
Purchase Details
Closed on
Oct 23, 2017
Sold by
Parra Juan
Bought by
Oviedo Yoseni and Gonzalez Jonathan
Current Estimated Value
Home Financials for this Owner
Home Financials are based on the most recent Mortgage that was taken out on this home.
Original Mortgage
$340,617
Outstanding Balance
$284,205
Interest Rate
3.78%
Mortgage Type
FHA
Estimated Equity
$387,141
Purchase Details
Closed on
Jul 9, 2015
Sold by
Marquez Dody M
Bought by
Parra Juan
Home Financials for this Owner
Home Financials are based on the most recent Mortgage that was taken out on this home.
Original Mortgage
$259,218
Interest Rate
3.25%
Mortgage Type
FHA
Purchase Details
Closed on
Sep 13, 2007
Sold by
Molina Guillermo and Barragan Marcela
Bought by
Marquez Dody M
Purchase Details
Closed on
Oct 31, 2000
Sold by
Hood Robert L and Hood Barbara A
Bought by
Molina Guillermo and Barragan Marcela
Create a Home Valuation Report for This Property
The Home Valuation Report is an in-depth analysis detailing your home's value as well as a comparison with similar homes in the area
Home Values in the Area
Average Home Value in this Area
Purchase History
| Date | Buyer | Sale Price | Title Company |
|---|---|---|---|
| Oviedo Yoseni | $369,900 | -- | |
| Parra Juan | $264,000 | -- | |
| Marquez Dody M | $160,000 | -- | |
| Molina Guillermo | $165,000 | -- |
Source: Public Records
Mortgage History
| Date | Status | Borrower | Loan Amount |
|---|---|---|---|
| Open | Oviedo Yoseni | $340,617 | |
| Previous Owner | Parra Juan | $259,218 | |
| Previous Owner | Molina Guillermo | $180,000 | |
| Previous Owner | Molina Guillermo | $95,000 | |
| Previous Owner | Molina Guillermo | $100,000 |
Source: Public Records
Tax History Compared to Growth
Tax History
| Year | Tax Paid | Tax Assessment Tax Assessment Total Assessment is a certain percentage of the fair market value that is determined by local assessors to be the total taxable value of land and additions on the property. | Land | Improvement |
|---|---|---|---|---|
| 2025 | $6,579 | $621,800 | $185,200 | $436,600 |
| 2024 | $5,934 | $546,400 | $161,900 | $384,500 |
| 2023 | $5,783 | $494,300 | $142,500 | $351,800 |
| 2022 | $5,238 | $401,400 | $116,600 | $284,800 |
| 2021 | $5,012 | $380,000 | $110,100 | $269,900 |
| 2020 | $4,806 | $357,600 | $110,100 | $247,500 |
| 2019 | $4,413 | $311,000 | $103,600 | $207,400 |
| 2018 | $3,559 | $249,400 | $97,100 | $152,300 |
| 2017 | $3,876 | $264,600 | $90,700 | $173,900 |
| 2016 | $3,540 | $239,000 | $84,200 | $154,800 |
| 2015 | -- | $231,600 | $84,200 | $147,400 |
Source: Public Records
Map
Nearby Homes
- 18 Union St Unit 20
- 14 Union St Unit 16
- 14-16 Union St
- 22 Union St
- 24 Union St Unit 26
- 24-26 Union St
- 10 Union St Unit 12
- 32 Union St Unit 34
- 32-34 Union St
- 34 Union St
- 8 River Place
- 8 River Place Unit 8
- 2 Edmond St
- 28 Union St Unit 30
- 28-30 Union St
- 29 Union St
- 27 Union St
- 25 Union St
- 8 Union St
- 6 Edmond St