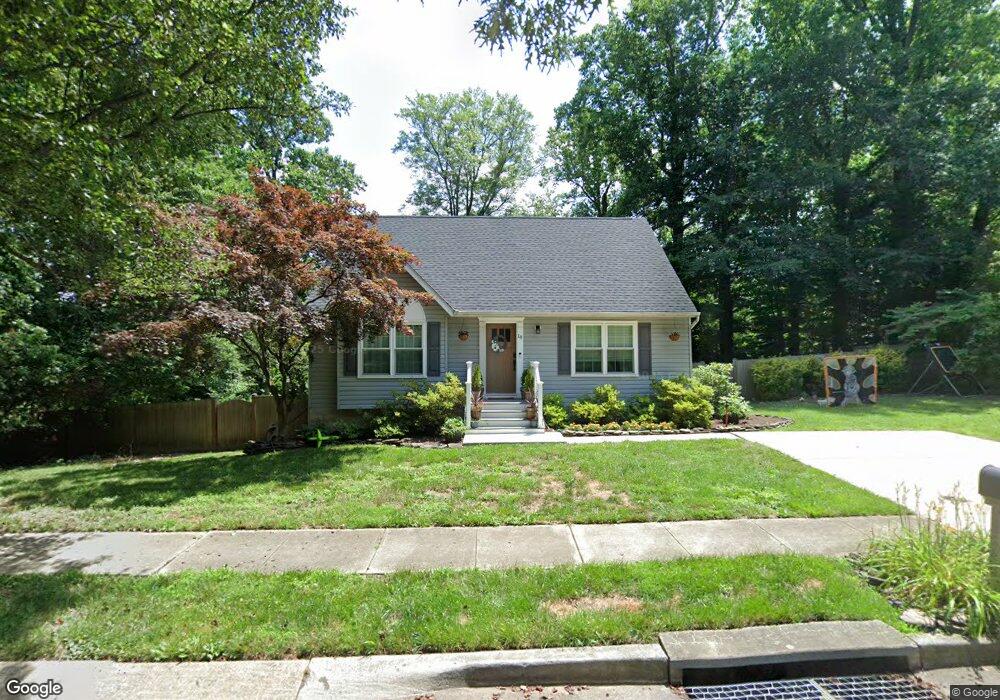
18 2nd St Annapolis, MD 21401
Estimated Value: $537,000 - $585,000
3
Beds
3
Baths
1,522
Sq Ft
$372/Sq Ft
Est. Value
About This Home
This home is located at 18 2nd St, Annapolis, MD 21401 and is currently estimated at $566,639, approximately $372 per square foot. 18 2nd St is a home located in Anne Arundel County with nearby schools including Rolling Knolls Elementary School, Wiley H. Bates Middle School, and Annapolis High School.
Ownership History
Date
Name
Owned For
Owner Type
Purchase Details
Closed on
Apr 19, 2010
Sold by
Wachovia Bank National Assoc
Bought by
Watson Michael and Watson Kristin
Current Estimated Value
Home Financials for this Owner
Home Financials are based on the most recent Mortgage that was taken out on this home.
Original Mortgage
$274,829
Outstanding Balance
$185,298
Interest Rate
5.25%
Mortgage Type
FHA
Estimated Equity
$381,341
Purchase Details
Closed on
Jun 18, 2004
Sold by
Gibson Kyle E
Bought by
Gibson Kyle E
Purchase Details
Closed on
Feb 3, 2000
Sold by
Gibson Kyle E
Bought by
Gibson Kyle E and Gibson Lisa A
Purchase Details
Closed on
Apr 5, 1994
Sold by
Greenwood Dev Corp
Bought by
Gibson Kyle E
Home Financials for this Owner
Home Financials are based on the most recent Mortgage that was taken out on this home.
Original Mortgage
$139,300
Interest Rate
7.07%
Create a Home Valuation Report for This Property
The Home Valuation Report is an in-depth analysis detailing your home's value as well as a comparison with similar homes in the area
Home Values in the Area
Average Home Value in this Area
Purchase History
| Date | Buyer | Sale Price | Title Company |
|---|---|---|---|
| Watson Michael | $279,900 | -- | |
| Wachovia Bank National Assoc | $292,670 | -- | |
| Gibson Kyle E | -- | -- | |
| Gibson Kyle E | -- | -- | |
| Gibson Kyle E | $146,635 | -- |
Source: Public Records
Mortgage History
| Date | Status | Borrower | Loan Amount |
|---|---|---|---|
| Open | Wachovia Bank National Assoc | $274,829 | |
| Closed | Watson Michael | $274,829 | |
| Previous Owner | Gibson Kyle E | $139,300 |
Source: Public Records
Tax History
| Year | Tax Paid | Tax Assessment Tax Assessment Total Assessment is a certain percentage of the fair market value that is determined by local assessors to be the total taxable value of land and additions on the property. | Land | Improvement |
|---|---|---|---|---|
| 2025 | $4,680 | $465,200 | -- | -- |
| 2024 | $4,680 | $428,800 | $0 | $0 |
| 2023 | $4,527 | $392,400 | $196,500 | $195,900 |
| 2022 | $4,238 | $388,700 | $0 | $0 |
| 2020 | $4,059 | $381,300 | $196,500 | $184,800 |
| 2019 | $3,979 | $363,333 | $0 | $0 |
| 2018 | $3,502 | $345,367 | $0 | $0 |
| 2017 | $3,719 | $327,400 | $0 | $0 |
| 2016 | -- | $322,467 | $0 | $0 |
| 2015 | -- | $317,533 | $0 | $0 |
| 2014 | -- | $312,600 | $0 | $0 |
Source: Public Records
Map
Nearby Homes
- 2572 Golfers Ridge Rd
- 810 Midship Ct
- 2510 Painter Ct
- 1943 Marconi Cir
- 926 Perry Landing Ct
- 1945 Marconi Cir
- 807 Eastern Point Rd
- 1955 Marconi Cir
- 2568 Forest Knoll
- 1909 Eleanor Ct
- 1907 Mackiebeth Ct
- 2667 Pemaquid Ct
- 1012 Mastline Dr
- 1010 Mastline Dr
- 803 Coxswain Way Unit 203
- 516 Kansala Dr
- 930 Astern Way Unit 512
- 930 Astern Way Unit 405
- 940 Astern Way Unit 102A
- 940 Astern Way Unit 309
Your Personal Tour Guide
Ask me questions while you tour the home.