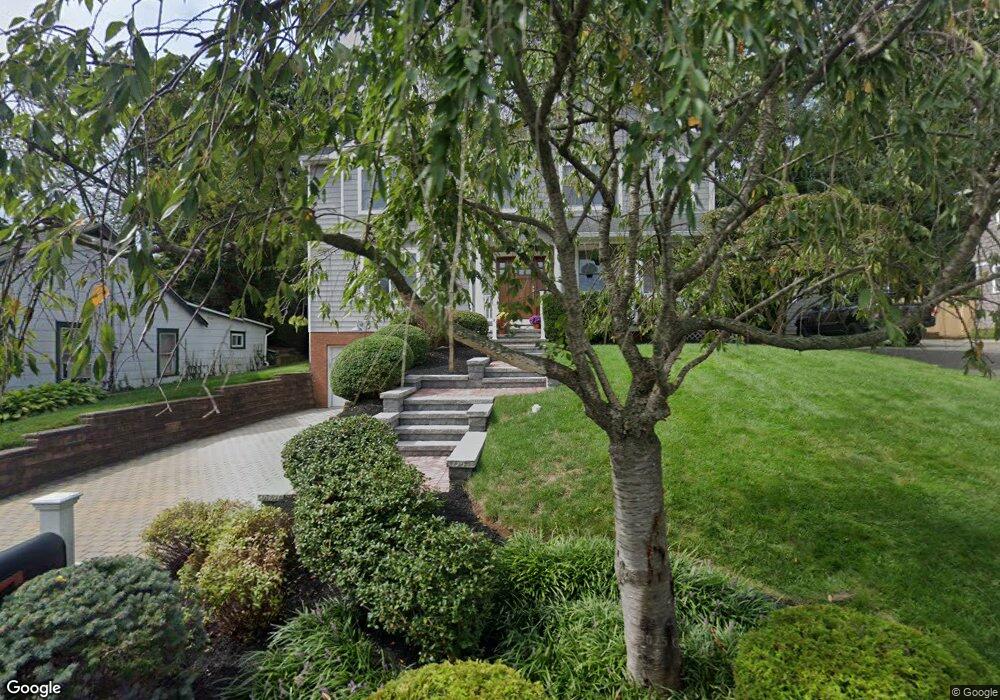
18 3rd St Rumson, NJ 07760
Estimated Value: $1,556,000 - $1,745,000
4
Beds
3
Baths
2,461
Sq Ft
$670/Sq Ft
Est. Value
About This Home
This home is located at 18 3rd St, Rumson, NJ 07760 and is currently estimated at $1,648,933, approximately $670 per square foot. 18 3rd St is a home located in Monmouth County with nearby schools including Deane Porter School, Forrestdale School, and Rumson Fair Haven Regional High School.
Ownership History
Date
Name
Owned For
Owner Type
Purchase Details
Closed on
May 20, 2008
Sold by
Lazarescu Gregg D and Lazarescu Marni B
Bought by
Leroy Daniel H and Huegel Claudia
Current Estimated Value
Home Financials for this Owner
Home Financials are based on the most recent Mortgage that was taken out on this home.
Original Mortgage
$417,000
Outstanding Balance
$264,912
Interest Rate
5.94%
Mortgage Type
Purchase Money Mortgage
Estimated Equity
$1,384,021
Purchase Details
Closed on
Feb 19, 2004
Sold by
Rumson Builders Llc
Bought by
Lazarescu Gregg and Lazarescu Mami
Home Financials for this Owner
Home Financials are based on the most recent Mortgage that was taken out on this home.
Original Mortgage
$525,000
Interest Rate
5.65%
Purchase Details
Closed on
Oct 10, 2002
Sold by
Blaustein Vija
Bought by
Rumson Builders Llc
Create a Home Valuation Report for This Property
The Home Valuation Report is an in-depth analysis detailing your home's value as well as a comparison with similar homes in the area
Home Values in the Area
Average Home Value in this Area
Purchase History
| Date | Buyer | Sale Price | Title Company |
|---|---|---|---|
| Leroy Daniel H | $850,000 | Stewart Title Guaranty Co | |
| Lazarescu Gregg | $699,900 | -- | |
| Rumson Builders Llc | $265,000 | -- |
Source: Public Records
Mortgage History
| Date | Status | Borrower | Loan Amount |
|---|---|---|---|
| Open | Leroy Daniel H | $417,000 | |
| Previous Owner | Lazarescu Gregg | $525,000 |
Source: Public Records
Tax History
| Year | Tax Paid | Tax Assessment Tax Assessment Total Assessment is a certain percentage of the fair market value that is determined by local assessors to be the total taxable value of land and additions on the property. | Land | Improvement |
|---|---|---|---|---|
| 2025 | $14,013 | $1,365,000 | $812,600 | $552,400 |
| 2024 | $14,120 | $1,273,900 | $758,600 | $515,300 |
| 2023 | $14,120 | $1,207,900 | $729,400 | $478,500 |
| 2022 | $13,999 | $1,106,700 | $646,500 | $460,200 |
| 2021 | $13,999 | $983,800 | $558,400 | $425,400 |
| 2020 | $13,383 | $933,900 | $514,400 | $419,500 |
| 2019 | $11,734 | $798,800 | $294,100 | $504,700 |
| 2018 | $11,656 | $786,500 | $294,100 | $492,400 |
| 2017 | $10,919 | $743,300 | $265,900 | $477,400 |
| 2016 | $10,555 | $736,600 | $265,900 | $470,700 |
| 2015 | $10,467 | $720,400 | $265,900 | $454,500 |
| 2014 | $10,304 | $707,200 | $260,100 | $447,100 |
Source: Public Records
Map
Nearby Homes
Your Personal Tour Guide
Ask me questions while you tour the home.