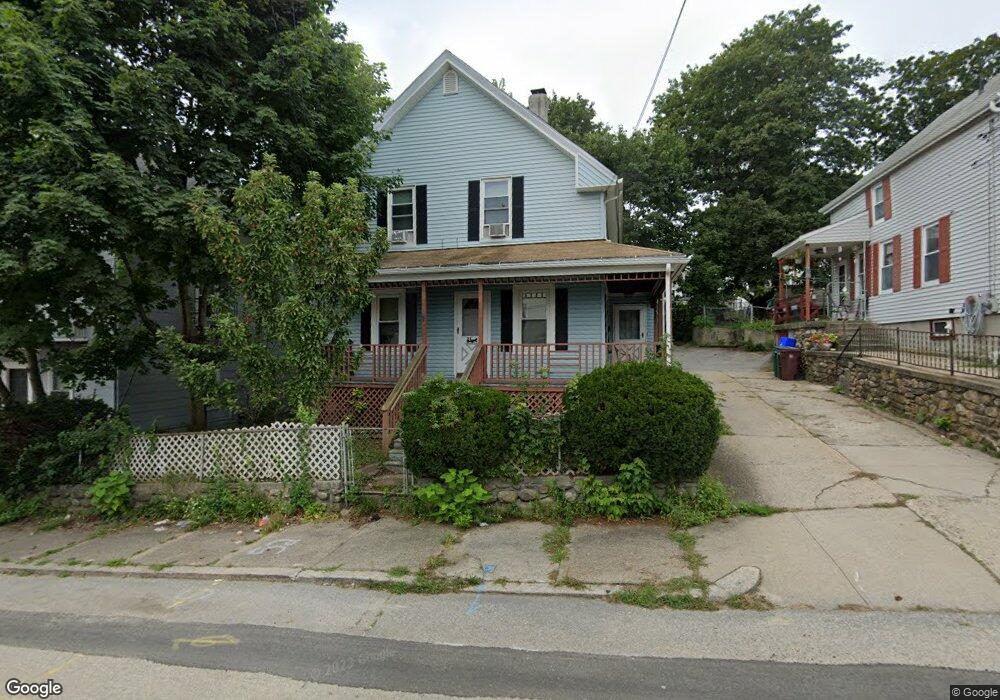
18 4th Ave Woonsocket, RI 02895
Fairmount NeighborhoodEstimated Value: $340,000 - $366,246
4
Beds
1
Bath
1,299
Sq Ft
$272/Sq Ft
Est. Value
About This Home
This home is located at 18 4th Ave, Woonsocket, RI 02895 and is currently estimated at $353,062, approximately $271 per square foot. 18 4th Ave is a home located in Providence County with nearby schools including Woonsocket High School, Founders Academy, and Beacon Charter School.
Ownership History
Date
Name
Owned For
Owner Type
Purchase Details
Closed on
Jul 29, 2009
Sold by
Deutsche Bk
Bought by
Vongsa Chak and Vongsa Elizabeth
Current Estimated Value
Home Financials for this Owner
Home Financials are based on the most recent Mortgage that was taken out on this home.
Original Mortgage
$74,840
Outstanding Balance
$48,943
Interest Rate
5.43%
Mortgage Type
Purchase Money Mortgage
Estimated Equity
$304,119
Purchase Details
Closed on
May 19, 2009
Sold by
Prescod Dale R
Bought by
Deutsche Bk
Purchase Details
Closed on
Sep 27, 2002
Sold by
Litton Loan Service Lp
Bought by
Prescod Dale R and Prescod Audra J
Purchase Details
Closed on
May 8, 2002
Sold by
Cr Bsed Asset Svc Llc
Bought by
Resmon
Purchase Details
Closed on
Jul 26, 1995
Sold by
Lindsey Isiah and Lindsey Martha
Bought by
Drish Charles E
Create a Home Valuation Report for This Property
The Home Valuation Report is an in-depth analysis detailing your home's value as well as a comparison with similar homes in the area
Home Values in the Area
Average Home Value in this Area
Purchase History
| Date | Buyer | Sale Price | Title Company |
|---|---|---|---|
| Vongsa Chak | $99,800 | -- | |
| Deutsche Bk | $186,752 | -- | |
| Prescod Dale R | $126,000 | -- | |
| Resmon | $64,000 | -- | |
| Drish Charles E | $78,000 | -- | |
| Vongsa Chak | $99,800 | -- | |
| Deutsche Bk | $186,752 | -- | |
| Prescod Dale R | $126,000 | -- | |
| Resmon | $64,000 | -- | |
| Drish Charles E | $78,000 | -- |
Source: Public Records
Mortgage History
| Date | Status | Borrower | Loan Amount |
|---|---|---|---|
| Open | Drish Charles E | $74,840 | |
| Closed | Drish Charles E | $19,960 |
Source: Public Records
Tax History
| Year | Tax Paid | Tax Assessment Tax Assessment Total Assessment is a certain percentage of the fair market value that is determined by local assessors to be the total taxable value of land and additions on the property. | Land | Improvement |
|---|---|---|---|---|
| 2025 | $3,750 | $333,900 | $86,100 | $247,800 |
| 2024 | $3,750 | $257,900 | $87,700 | $170,200 |
| 2023 | $3,605 | $257,900 | $87,700 | $170,200 |
| 2022 | $3,605 | $257,900 | $87,700 | $170,200 |
| 2021 | $2,974 | $125,200 | $35,000 | $90,200 |
| 2020 | $3,005 | $125,200 | $35,000 | $90,200 |
| 2018 | $3,015 | $125,200 | $35,000 | $90,200 |
| 2017 | $3,699 | $122,900 | $39,100 | $83,800 |
| 2016 | $3,913 | $122,900 | $39,100 | $83,800 |
| 2015 | $4,496 | $122,900 | $39,100 | $83,800 |
| 2014 | $4,237 | $117,900 | $43,100 | $74,800 |
Source: Public Records
Map
Nearby Homes
- 83 4th Ave
- 123 4th Ave
- 435 S Main St
- 0 10th Ave
- 10 10th Ave
- 0 Holbrook Ln Unit 1402850
- 84 Bernice Ave
- 190 Coe St
- 120 East St
- 43 Summit St
- 36 Fairmount St
- 184 Avenue C Unit 2
- 184 Avenue C Unit 5
- 184 Avenue C Unit 6
- 184 Avenue C Unit 3
- 184 Avenue C Unit 4
- 184 Avenue C Unit 1
- 372 River St
- 42 Transit St
- 34 Smithfield Rd
Your Personal Tour Guide
Ask me questions while you tour the home.