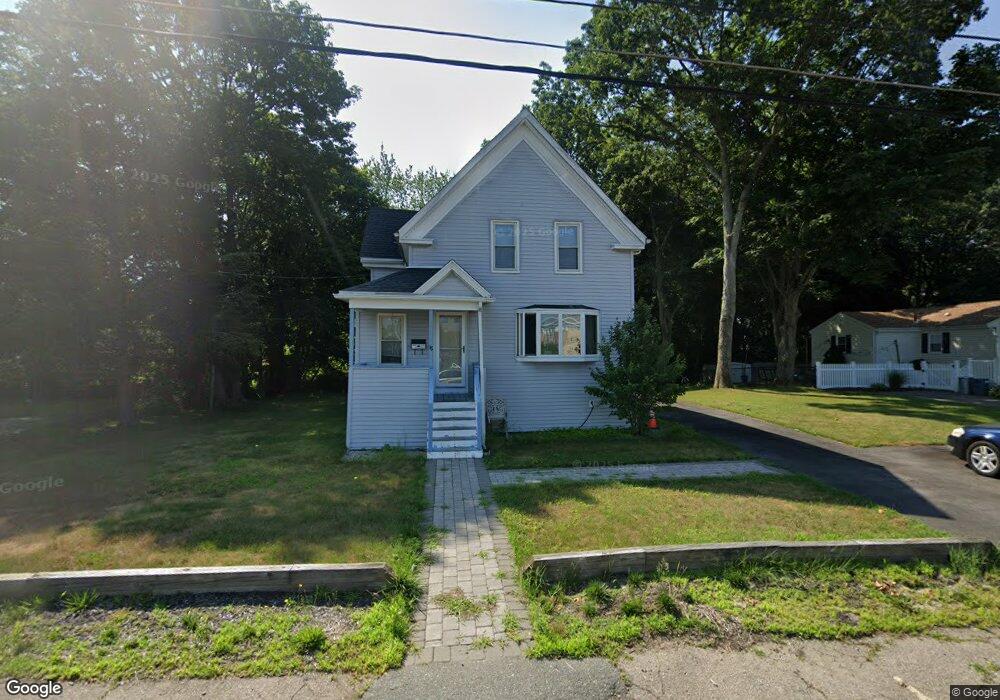
18 Adams St Stoughton, MA 02072
Estimated Value: $545,000 - $681,000
4
Beds
3
Baths
1,667
Sq Ft
$368/Sq Ft
Est. Value
About This Home
This home is located at 18 Adams St, Stoughton, MA 02072 and is currently estimated at $612,951, approximately $367 per square foot. 18 Adams St is a home located in Norfolk County with nearby schools including Wilkins Elementary School, Dr. Robert G. O'Donnell Middle School, and Stoughton High School.
Ownership History
Date
Name
Owned For
Owner Type
Purchase Details
Closed on
Dec 6, 1988
Sold by
Parshley Walter
Bought by
Hayes Paulette L
Current Estimated Value
Home Financials for this Owner
Home Financials are based on the most recent Mortgage that was taken out on this home.
Original Mortgage
$130,000
Interest Rate
10.19%
Mortgage Type
Purchase Money Mortgage
Purchase Details
Closed on
Nov 30, 1987
Sold by
Kilm Anthony M
Bought by
Parshley Walter C
Create a Home Valuation Report for This Property
The Home Valuation Report is an in-depth analysis detailing your home's value as well as a comparison with similar homes in the area
Home Values in the Area
Average Home Value in this Area
Purchase History
| Date | Buyer | Sale Price | Title Company |
|---|---|---|---|
| Hayes Paulette L | $149,900 | -- | |
| Parshley Walter C | $139,000 | -- |
Source: Public Records
Mortgage History
| Date | Status | Borrower | Loan Amount |
|---|---|---|---|
| Closed | Parshley Walter C | $43,700 | |
| Open | Parshley Walter C | $87,000 | |
| Closed | Parshley Walter C | $108,900 | |
| Closed | Parshley Walter C | $130,000 |
Source: Public Records
Tax History Compared to Growth
Tax History
| Year | Tax Paid | Tax Assessment Tax Assessment Total Assessment is a certain percentage of the fair market value that is determined by local assessors to be the total taxable value of land and additions on the property. | Land | Improvement |
|---|---|---|---|---|
| 2025 | $6,409 | $517,700 | $211,600 | $306,100 |
| 2024 | $6,351 | $498,900 | $192,800 | $306,100 |
| 2023 | $6,152 | $454,000 | $179,200 | $274,800 |
| 2022 | $5,898 | $409,300 | $163,800 | $245,500 |
| 2021 | $5,552 | $367,700 | $148,500 | $219,200 |
| 2020 | $5,399 | $362,600 | $143,400 | $219,200 |
| 2019 | $5,108 | $333,000 | $143,400 | $189,600 |
| 2018 | $4,758 | $321,300 | $136,500 | $184,800 |
| 2017 | $4,256 | $293,700 | $129,700 | $164,000 |
| 2016 | $4,127 | $275,700 | $119,500 | $156,200 |
| 2015 | $4,067 | $268,800 | $112,600 | $156,200 |
| 2014 | $3,952 | $251,100 | $102,400 | $148,700 |
Source: Public Records
Map
Nearby Homes