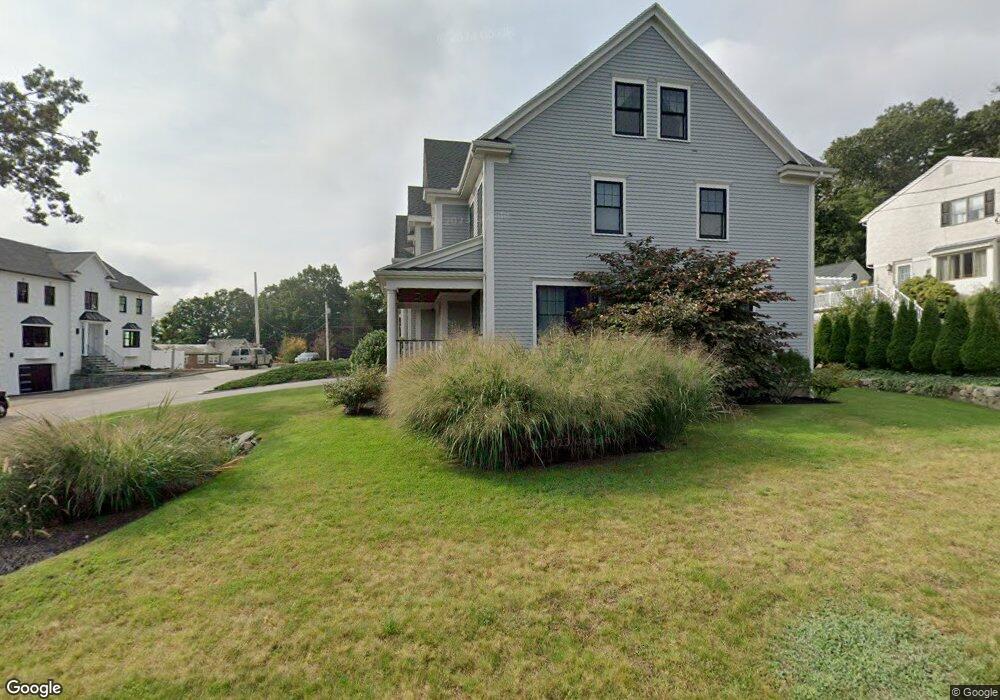
18 Agawam Rd Winchester, MA 01890
West Side NeighborhoodEstimated Value: $2,541,000 - $2,920,000
4
Beds
4
Baths
4,475
Sq Ft
$596/Sq Ft
Est. Value
About This Home
This home is located at 18 Agawam Rd, Winchester, MA 01890 and is currently estimated at $2,669,262, approximately $596 per square foot. 18 Agawam Rd is a home with nearby schools including Ambrose Elementary School, McCall Middle School, and Winchester High School.
Ownership History
Date
Name
Owned For
Owner Type
Purchase Details
Closed on
Sep 22, 2010
Sold by
Melanson Dev Group Inc
Bought by
Donaldson Scott M and Donaldson Nancy G
Current Estimated Value
Home Financials for this Owner
Home Financials are based on the most recent Mortgage that was taken out on this home.
Original Mortgage
$417,000
Outstanding Balance
$275,917
Interest Rate
4.48%
Mortgage Type
Purchase Money Mortgage
Estimated Equity
$2,393,345
Create a Home Valuation Report for This Property
The Home Valuation Report is an in-depth analysis detailing your home's value as well as a comparison with similar homes in the area
Home Values in the Area
Average Home Value in this Area
Purchase History
| Date | Buyer | Sale Price | Title Company |
|---|---|---|---|
| Donaldson Scott M | $1,291,500 | -- |
Source: Public Records
Mortgage History
| Date | Status | Borrower | Loan Amount |
|---|---|---|---|
| Open | Donaldson Scott M | $417,000 |
Source: Public Records
Tax History Compared to Growth
Tax History
| Year | Tax Paid | Tax Assessment Tax Assessment Total Assessment is a certain percentage of the fair market value that is determined by local assessors to be the total taxable value of land and additions on the property. | Land | Improvement |
|---|---|---|---|---|
| 2025 | $244 | $2,201,300 | $926,500 | $1,274,800 |
| 2024 | $23,162 | $2,044,300 | $860,300 | $1,184,000 |
| 2023 | $22,618 | $1,916,800 | $761,000 | $1,155,800 |
| 2022 | $22,115 | $1,767,800 | $694,900 | $1,072,900 |
| 2021 | $21,195 | $1,652,000 | $579,100 | $1,072,900 |
| 2020 | $20,058 | $1,618,900 | $546,000 | $1,072,900 |
| 2019 | $18,803 | $1,552,700 | $479,800 | $1,072,900 |
| 2018 | $18,235 | $1,495,900 | $452,500 | $1,043,400 |
| 2017 | $17,560 | $1,430,000 | $426,000 | $1,004,000 |
| 2016 | $16,351 | $1,399,900 | $426,000 | $973,900 |
| 2015 | $16,083 | $1,324,800 | $387,100 | $937,700 |
| 2014 | $15,738 | $1,243,100 | $322,600 | $920,500 |
Source: Public Records
Map
Nearby Homes