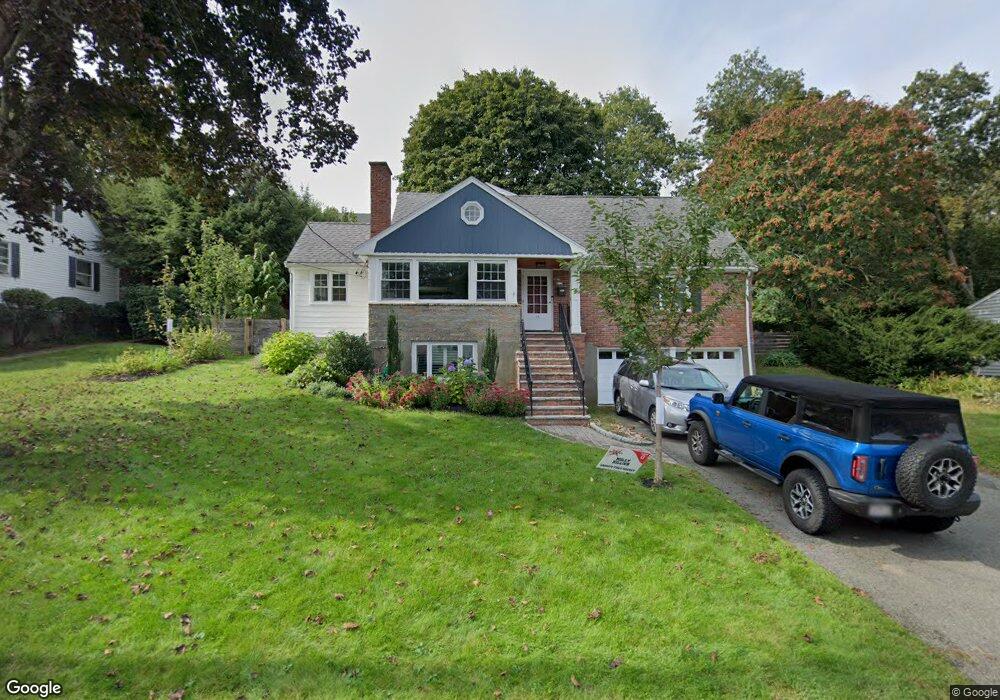
18 Albamont Rd Winchester, MA 01890
West Side NeighborhoodEstimated Value: $1,563,000 - $1,823,000
5
Beds
4
Baths
3,873
Sq Ft
$442/Sq Ft
Est. Value
About This Home
This home is located at 18 Albamont Rd, Winchester, MA 01890 and is currently estimated at $1,710,876, approximately $441 per square foot. 18 Albamont Rd is a home located in Middlesex County with nearby schools including Vinson-Owen Elementary School, McCall Middle School, and Winchester High School.
Ownership History
Date
Name
Owned For
Owner Type
Purchase Details
Closed on
Aug 14, 2008
Sold by
Mcnutt Brian R and Mcnutt Cynthia L
Bought by
Hillier Debra F and Hillier Timothy S
Current Estimated Value
Home Financials for this Owner
Home Financials are based on the most recent Mortgage that was taken out on this home.
Original Mortgage
$610,000
Outstanding Balance
$401,733
Interest Rate
6.4%
Mortgage Type
Purchase Money Mortgage
Estimated Equity
$1,309,143
Create a Home Valuation Report for This Property
The Home Valuation Report is an in-depth analysis detailing your home's value as well as a comparison with similar homes in the area
Home Values in the Area
Average Home Value in this Area
Purchase History
| Date | Buyer | Sale Price | Title Company |
|---|---|---|---|
| Hillier Debra F | $685,000 | -- |
Source: Public Records
Mortgage History
| Date | Status | Borrower | Loan Amount |
|---|---|---|---|
| Open | Hillier Debra F | $610,000 |
Source: Public Records
Tax History Compared to Growth
Tax History
| Year | Tax Paid | Tax Assessment Tax Assessment Total Assessment is a certain percentage of the fair market value that is determined by local assessors to be the total taxable value of land and additions on the property. | Land | Improvement |
|---|---|---|---|---|
| 2025 | $139 | $1,250,300 | $674,400 | $575,900 |
| 2024 | $13,756 | $1,214,100 | $640,700 | $573,400 |
| 2023 | $13,031 | $1,104,300 | $556,400 | $547,900 |
| 2022 | $13,184 | $1,053,900 | $505,800 | $548,100 |
| 2021 | $12,657 | $986,500 | $438,400 | $548,100 |
| 2020 | $12,086 | $975,500 | $429,900 | $545,600 |
| 2019 | $11,013 | $909,400 | $387,800 | $521,600 |
| 2018 | $10,660 | $874,500 | $369,200 | $505,300 |
| 2017 | $10,340 | $842,000 | $369,200 | $472,800 |
| 2016 | $9,567 | $819,100 | $362,500 | $456,600 |
| 2015 | $8,644 | $712,000 | $337,200 | $374,800 |
| 2014 | $8,762 | $692,100 | $328,800 | $363,300 |
Source: Public Records
Map
Nearby Homes
- 16 Albamont Rd
- 22 Albamont Rd
- 37 Robinhood Rd
- 33 Robinhood Rd
- 19 Albamont Rd
- 21 Albamont Rd
- 39 Robinhood Rd
- 12 Albamont Rd
- 24 Albamont Rd
- 15 Albamont Rd
- 23 Albamont Rd
- 31 Robinhood Rd
- 25 Albamont Rd
- 43 Robinhood Rd
- 11 Albamont Rd
- 10 Albamont Rd
- 34 Robinhood Rd
- 36 Robinhood Rd
- 29 Robinhood Rd
- 18 New Meadows Rd