Estimated Value: $261,206 - $351,000
--
Bed
1
Bath
2,639
Sq Ft
$111/Sq Ft
Est. Value
About This Home
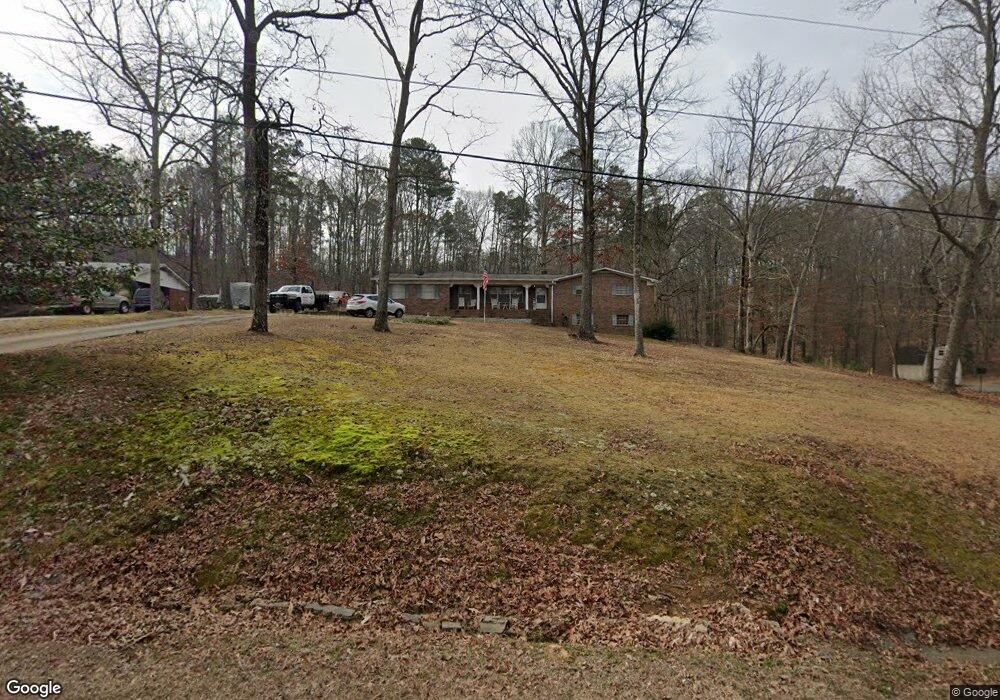
This home is located at 18 Albion Dr SW, Rome, GA 30165 and is currently estimated at $294,052, approximately $111 per square foot. 18 Albion Dr SW is a home located in Floyd County with nearby schools including Coosa Middle School and Coosa High School.
Ownership History
Date
Name
Owned For
Owner Type
Purchase Details
Closed on
Nov 26, 2024
Sold by
Brown Charlotte D
Bought by
Mccain Charlotte D and Mccain Dannie Wayne
Current Estimated Value
Purchase Details
Closed on
Apr 4, 2023
Sold by
Wooten William F
Bought by
Brown Charlotte D
Purchase Details
Closed on
Jun 8, 2011
Sold by
Wooten William F
Bought by
Brown Charlotte D
Purchase Details
Closed on
May 9, 2011
Sold by
Wooten William F
Bought by
Wooten William F
Purchase Details
Closed on
Jan 30, 1976
Sold by
Rennington Rohe V and Rennington Martha C
Bought by
Wooten Wm F and Mrs Helen
Purchase Details
Closed on
Sep 21, 1970
Sold by
Benton Benny M
Bought by
Rennington Rohe V and Rennington Martha C
Purchase Details
Closed on
Apr 9, 1965
Sold by
Downs Ralph and Downs Betty
Bought by
Benton Benny M
Purchase Details
Closed on
Feb 2, 1963
Bought by
Downs Ralph and Downs Betty
Create a Home Valuation Report for This Property
The Home Valuation Report is an in-depth analysis detailing your home's value as well as a comparison with similar homes in the area
Home Values in the Area
Average Home Value in this Area
Purchase History
| Date | Buyer | Sale Price | Title Company |
|---|---|---|---|
| Mccain Charlotte D | -- | -- | |
| Brown Charlotte D | -- | -- | |
| Brown Charlotte D | -- | -- | |
| Brown Charlotte D | -- | -- | |
| Brown Charlotte D | -- | -- | |
| Wooten William F | -- | -- | |
| Wooten William F | -- | -- | |
| Wooten William F | -- | -- | |
| Wooten William F | -- | -- | |
| Wooten Wm F | $39,900 | -- | |
| Rennington Rohe V | $32,000 | -- | |
| Benton Benny M | -- | -- | |
| Downs Ralph | -- | -- |
Source: Public Records
Tax History Compared to Growth
Tax History
| Year | Tax Paid | Tax Assessment Tax Assessment Total Assessment is a certain percentage of the fair market value that is determined by local assessors to be the total taxable value of land and additions on the property. | Land | Improvement |
|---|---|---|---|---|
| 2024 | $206 | $97,046 | $12,420 | $84,626 |
| 2023 | $2,635 | $91,891 | $11,040 | $80,851 |
| 2022 | $966 | $65,949 | $8,970 | $56,979 |
| 2021 | $830 | $58,370 | $8,970 | $49,400 |
| 2020 | $745 | $53,198 | $6,900 | $46,298 |
| 2019 | $672 | $50,097 | $6,900 | $43,197 |
| 2018 | $616 | $46,995 | $6,900 | $40,095 |
| 2017 | $568 | $45,140 | $6,900 | $38,240 |
| 2016 | $562 | $44,738 | $6,880 | $37,858 |
| 2015 | $529 | $44,738 | $6,880 | $37,858 |
| 2014 | $529 | $44,738 | $6,880 | $37,858 |
Source: Public Records
Map
Nearby Homes
- 2890 Alabama Hwy NW
- 3105 Barker Rd SW
- 130 Thornwood Dr SW
- 124 Beech Creek Dr NW
- 125 Thornwood Dr SW
- 120 Thornwood Dr SW
- 23 Bush Arbor Place SW
- 104 Beech Creek Dr NW
- 106 Eden Dr NW
- 10 Bush Arbor Place SW
- 2604 Shorter Ave NW
- 8 Bush Arbor Place SW
- 203 Hycliff Rd SW
- 7 Eden Dr NW
- 224 Rolling Oaks Dr NW
- 121 Kenwood Dr SW
- 3605 Garden Lakes Pkwy
- 18 Albion Dr SW
- 22 Albion Dr SW
- 0 Intervale Dr SW Unit 8445160
- 0 Intervale Dr SW
- 8 Intervale Dr SW
- 19 Albion Dr SW
- 21 Albion Dr SW
- 14 Cabot Dr SW
- 0 Cabot Dr SW Unit 7132655
- 0 Cabot Dr SW
- 14 Albion Dr SW
- 25 Albion Dr SW
- 17 Albion Dr SW
- 17 Albion Dr SW
- 5 Halbury Dr SW
- 5 Halbury Dr SW
- 30 Albion Dr SW
- 29 Albion Dr SW
- 29 Albion Dr SW
- 29 Albion Dr SW