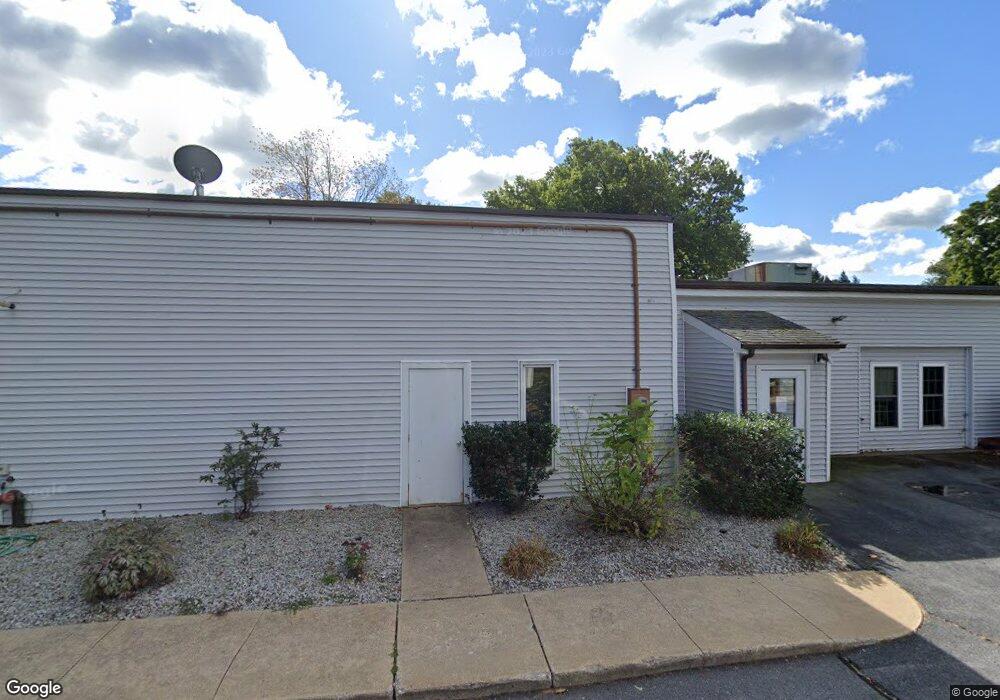
18 Allen St Leominster, MA 01453
Estimated Value: $548,656 - $614,000
12
Beds
2
Baths
3,890
Sq Ft
$150/Sq Ft
Est. Value
About This Home
This home is located at 18 Allen St, Leominster, MA 01453 and is currently estimated at $583,164, approximately $149 per square foot. 18 Allen St is a home located in Worcester County with nearby schools including Leominster High School, St. Leo School, and St. Anna Catholic School.
Ownership History
Date
Name
Owned For
Owner Type
Purchase Details
Closed on
Sep 19, 1997
Sold by
W J Galvin Nt and Galvin W John
Bought by
Mujirfield Dev Llc
Current Estimated Value
Home Financials for this Owner
Home Financials are based on the most recent Mortgage that was taken out on this home.
Original Mortgage
$152,000
Interest Rate
7.38%
Mortgage Type
Purchase Money Mortgage
Create a Home Valuation Report for This Property
The Home Valuation Report is an in-depth analysis detailing your home's value as well as a comparison with similar homes in the area
Home Values in the Area
Average Home Value in this Area
Purchase History
| Date | Buyer | Sale Price | Title Company |
|---|---|---|---|
| Mujirfield Dev Llc | $190,000 | -- |
Source: Public Records
Mortgage History
| Date | Status | Borrower | Loan Amount |
|---|---|---|---|
| Open | Mujirfield Dev Llc | $900,000 | |
| Closed | Mujirfield Dev Llc | $208,348 | |
| Closed | Mujirfield Dev Llc | $395,000 | |
| Closed | Mujirfield Dev Llc | $152,000 |
Source: Public Records
Tax History Compared to Growth
Tax History
| Year | Tax Paid | Tax Assessment Tax Assessment Total Assessment is a certain percentage of the fair market value that is determined by local assessors to be the total taxable value of land and additions on the property. | Land | Improvement |
|---|---|---|---|---|
| 2025 | $5,773 | $411,500 | $125,800 | $285,700 |
| 2024 | $5,196 | $358,100 | $119,900 | $238,200 |
| 2023 | $4,821 | $310,200 | $104,200 | $206,000 |
| 2022 | $4,496 | $271,500 | $90,600 | $180,900 |
| 2021 | $4,513 | $248,900 | $70,600 | $178,300 |
| 2020 | $12,711 | $235,100 | $70,600 | $164,500 |
| 2019 | $4,296 | $231,700 | $67,200 | $164,500 |
| 2018 | $0 | $223,200 | $65,300 | $157,900 |
| 2017 | $4,449 | $225,500 | $61,000 | $164,500 |
| 2016 | $4,159 | $212,400 | $61,000 | $151,400 |
| 2015 | $4,129 | $212,400 | $61,000 | $151,400 |
| 2014 | $6,305 | $333,800 | $66,800 | $267,000 |
Source: Public Records
Map
Nearby Homes
- 66 Hamilton St Unit 3
- 593 Main St Unit SL4
- 89 Benjamin St
- 23 High St
- 43 High St
- 76 Belmont Rd
- 57 Liberty St Unit 2
- 58 4th St
- 15 6th St
- 95 Laurel St
- 278 Water St
- 22 Prescott St
- 12 Lindell Ave
- 150 Washington St
- 51 Grove Ave
- 45 Fruit St Unit A
- 45 Fruit St Unit B
- 39 Laurel St
- 91 Orchard St
- 16 Depot Square