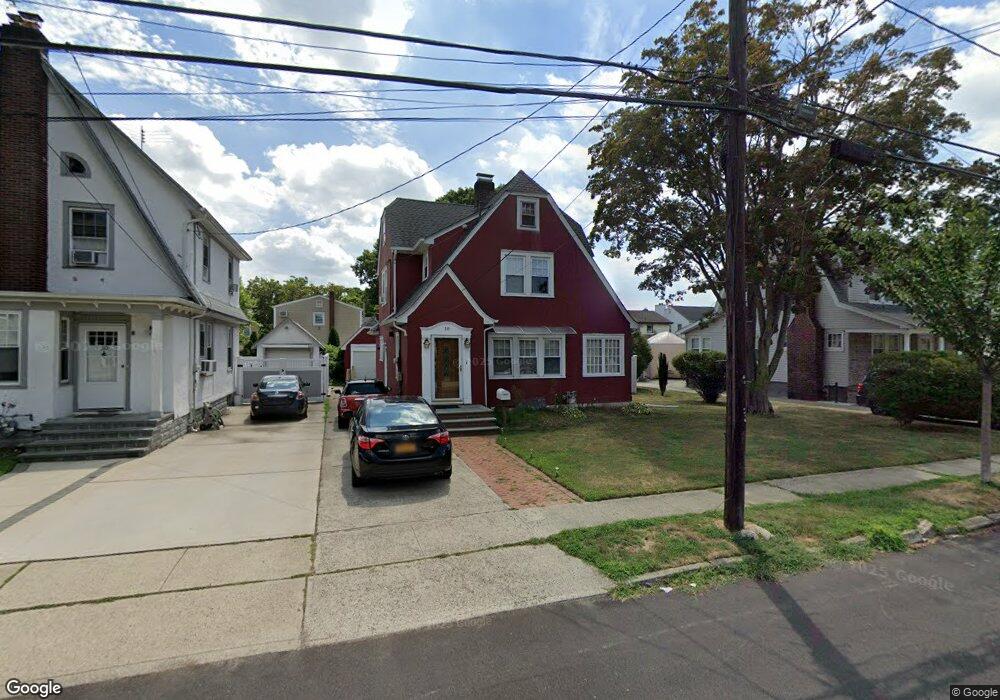
18 Allen St Lynbrook, NY 11563
Estimated Value: $740,885 - $770,000
3
Beds
2
Baths
1,619
Sq Ft
$467/Sq Ft
Est. Value
About This Home
This home is located at 18 Allen St, Lynbrook, NY 11563 and is currently estimated at $755,443, approximately $466 per square foot. 18 Allen St is a home located in Nassau County with nearby schools including Davison Avenue Intermediate School, Maurice W. Downing Primary K-2 School, and Howard T Herber Middle School.
Ownership History
Date
Name
Owned For
Owner Type
Purchase Details
Closed on
Dec 28, 2017
Sold by
Sullivan Thomas O and Sullivan Sharon O
Bought by
Hurtubise Sebastien Lessard and Lessard Orrego Cynthia E
Current Estimated Value
Home Financials for this Owner
Home Financials are based on the most recent Mortgage that was taken out on this home.
Original Mortgage
$490,943
Outstanding Balance
$416,187
Interest Rate
4.12%
Mortgage Type
FHA
Estimated Equity
$339,256
Create a Home Valuation Report for This Property
The Home Valuation Report is an in-depth analysis detailing your home's value as well as a comparison with similar homes in the area
Home Values in the Area
Average Home Value in this Area
Purchase History
| Date | Buyer | Sale Price | Title Company |
|---|---|---|---|
| Hurtubise Sebastien Lessard | $500,000 | -- |
Source: Public Records
Mortgage History
| Date | Status | Borrower | Loan Amount |
|---|---|---|---|
| Open | Hurtubise Sebastien Lessard | $490,943 |
Source: Public Records
Tax History Compared to Growth
Tax History
| Year | Tax Paid | Tax Assessment Tax Assessment Total Assessment is a certain percentage of the fair market value that is determined by local assessors to be the total taxable value of land and additions on the property. | Land | Improvement |
|---|---|---|---|---|
| 2025 | $9,495 | $454 | $177 | $277 |
| 2024 | $947 | $464 | $181 | $283 |
| 2023 | $8,865 | $481 | $188 | $293 |
| 2022 | $8,865 | $481 | $188 | $293 |
| 2021 | $12,269 | $468 | $183 | $285 |
| 2020 | $9,019 | $483 | $372 | $111 |
| 2019 | $963 | $483 | $349 | $134 |
| 2018 | $6,061 | $515 | $0 | $0 |
| 2017 | $2,816 | $547 | $351 | $196 |
| 2016 | $3,506 | $579 | $337 | $242 |
| 2015 | $792 | $611 | $355 | $256 |
| 2014 | $792 | $611 | $355 | $256 |
| 2013 | $761 | $640 | $372 | $268 |
Source: Public Records
Map
Nearby Homes