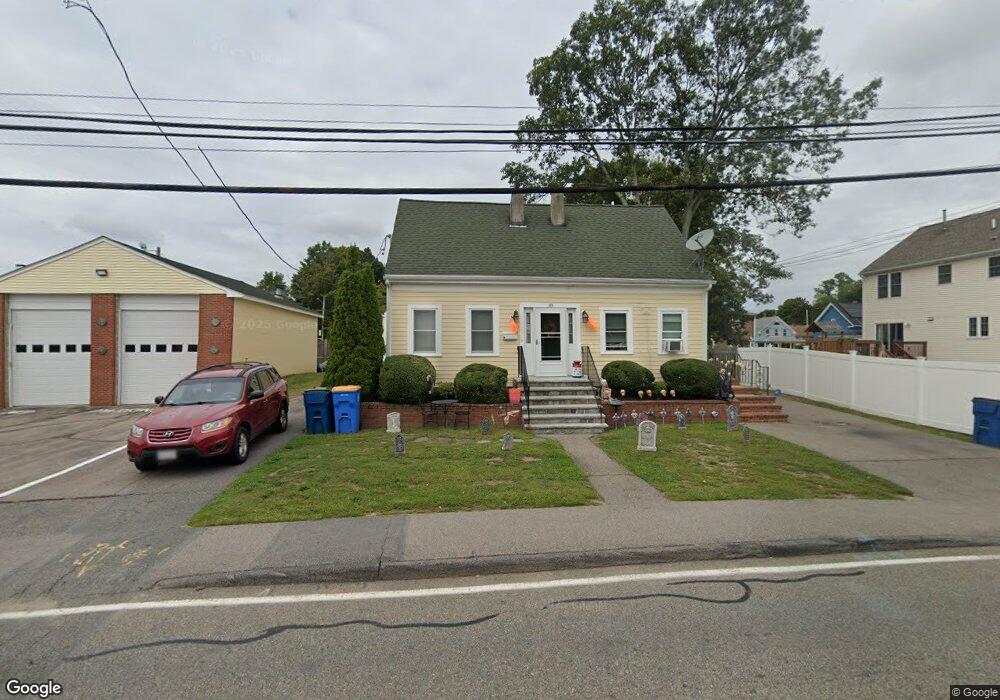
18 Allen St Randolph, MA 02368
North Randolph NeighborhoodEstimated Value: $611,000 - $880,000
4
Beds
2
Baths
1,970
Sq Ft
$364/Sq Ft
Est. Value
About This Home
This home is located at 18 Allen St, Randolph, MA 02368 and is currently estimated at $716,280, approximately $363 per square foot. 18 Allen St is a home located in Norfolk County with nearby schools including Randolph High School, Boston Higashi School, and Lighthouse Baptist Christian Academy.
Ownership History
Date
Name
Owned For
Owner Type
Purchase Details
Closed on
Jan 27, 2005
Sold by
Cartwright Brad J and Cartwright Scott F
Bought by
Randolph Allen Street
Current Estimated Value
Purchase Details
Closed on
Sep 29, 2004
Sold by
18 Allen Street T and Cartwright Brad J
Bought by
Cartwright Brad J and Cartwright Scott J
Home Financials for this Owner
Home Financials are based on the most recent Mortgage that was taken out on this home.
Original Mortgage
$297,500
Interest Rate
5.81%
Mortgage Type
Purchase Money Mortgage
Purchase Details
Closed on
Feb 3, 1989
Sold by
Whynot Lawrence A
Bought by
18 Allen St T
Home Financials for this Owner
Home Financials are based on the most recent Mortgage that was taken out on this home.
Original Mortgage
$148,000
Interest Rate
10.62%
Mortgage Type
Purchase Money Mortgage
Create a Home Valuation Report for This Property
The Home Valuation Report is an in-depth analysis detailing your home's value as well as a comparison with similar homes in the area
Home Values in the Area
Average Home Value in this Area
Purchase History
| Date | Buyer | Sale Price | Title Company |
|---|---|---|---|
| Randolph Allen Street | -- | -- | |
| Cartwright Brad J | -- | -- | |
| 18 Allen St T | $155,000 | -- |
Source: Public Records
Mortgage History
| Date | Status | Borrower | Loan Amount |
|---|---|---|---|
| Previous Owner | Cartwright Brad J | $297,500 | |
| Previous Owner | 18 Allen St T | $148,000 |
Source: Public Records
Tax History
| Year | Tax Paid | Tax Assessment Tax Assessment Total Assessment is a certain percentage of the fair market value that is determined by local assessors to be the total taxable value of land and additions on the property. | Land | Improvement |
|---|---|---|---|---|
| 2025 | $7,261 | $625,400 | $229,100 | $396,300 |
| 2024 | $6,707 | $585,800 | $224,600 | $361,200 |
| 2023 | $6,250 | $517,400 | $204,100 | $313,300 |
| 2022 | $6,090 | $447,800 | $170,100 | $277,700 |
| 2021 | $6,420 | $434,400 | $141,800 | $292,600 |
| 2020 | $6,380 | $427,900 | $141,800 | $286,100 |
| 2019 | $6,019 | $401,800 | $135,000 | $266,800 |
| 2018 | $5,544 | $349,100 | $122,700 | $226,400 |
| 2017 | $5,440 | $336,200 | $116,900 | $219,300 |
| 2016 | $4,384 | $252,100 | $106,300 | $145,800 |
| 2015 | $4,174 | $230,600 | $101,200 | $129,400 |
Source: Public Records
Map
Nearby Homes
- 21 West St Unit A4
- 41 West St Unit C2
- 16 Grove Square Unit 16
- 156 Allen St
- 12 Cottage St
- 153 West St
- 55 Silver St
- 591 N Main St
- 33 Vesey Rd
- 8 Plain St
- 20 Simmonds Blvd Unit 20
- 18 Simmonds Blvd Unit 18
- 8 Simmonds Blvd Unit 8
- 22 Simmonds Blvd Unit 22
- 10 Simmonds Blvd Unit 10
- 24 Simmonds Blvd Unit 24
- 14 Simmonds Blvd Unit 14
- 6 Simmonds Blvd Unit 6
- 12 Simmonds Blvd Unit 12
- 6 Eagle Rd
- 17 Allen St
- 11 Mount Pleasant Square
- 409 N Main St
- 6 Roel St
- 6 Roel St Unit 1
- 21 Allen St
- 28 Allen St
- 27 Mount Pleasant Square
- 32 Roel St
- 4 Mount Pleasant Square
- 14 Mount Pleasant Square
- 18 Mount Pleasant Square
- 18 Mount Pleasant Square Unit 2
- 18 Mount Pleasant Square Unit 1
- 427 N Main St
- 28 Mount Pleasant Square
- 28 Mount Pleasant Square Unit A
- 28 Mount Pleasant Square Unit A
- 410 N Main St
- 410 N Main St Unit 2