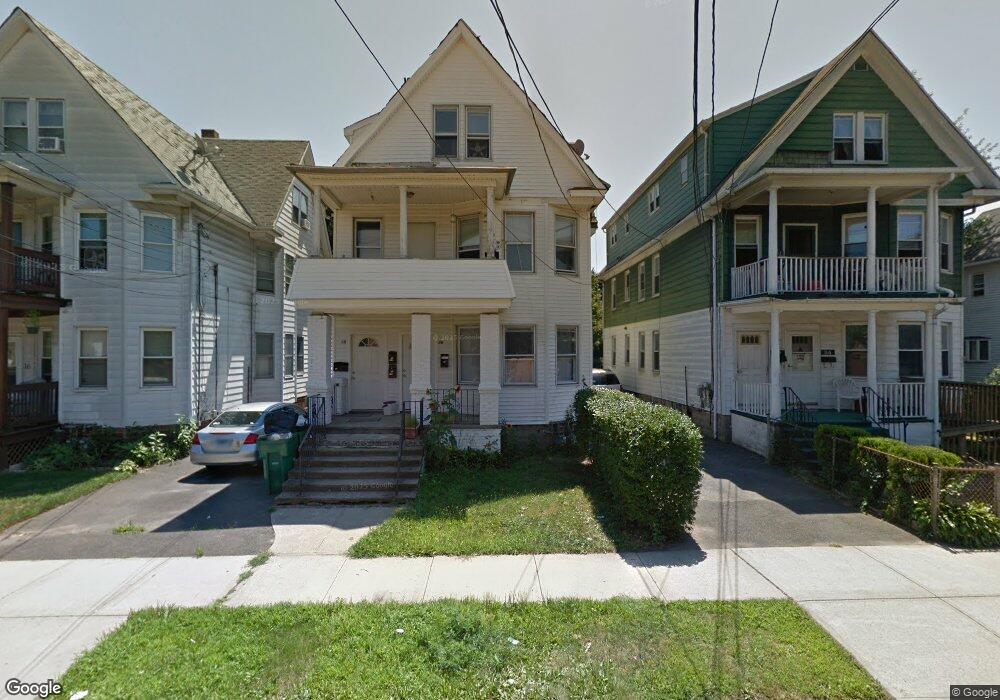
18 Alling St West Haven, CT 06516
Allingtown NeighborhoodEstimated Value: $393,000 - $523,000
5
Beds
3
Baths
3,069
Sq Ft
$151/Sq Ft
Est. Value
About This Home
This home is located at 18 Alling St, West Haven, CT 06516 and is currently estimated at $463,366, approximately $150 per square foot. 18 Alling St is a home located in New Haven County with nearby schools including Carrigan 5/6 Intermediate School, Harry M. Bailey Middle School, and West Haven High School.
Ownership History
Date
Name
Owned For
Owner Type
Purchase Details
Closed on
Aug 29, 2001
Sold by
Yalarta Wilmot B and Yalarta Joyce A
Bought by
Venter Jonathan S and Venter Colleen A
Current Estimated Value
Home Financials for this Owner
Home Financials are based on the most recent Mortgage that was taken out on this home.
Original Mortgage
$116,100
Outstanding Balance
$45,503
Interest Rate
7.06%
Mortgage Type
Purchase Money Mortgage
Estimated Equity
$417,863
Purchase Details
Closed on
Nov 22, 1995
Sold by
New Haven Sb
Bought by
Yalartai Harmon D and Yalartai Wilmot B
Home Financials for this Owner
Home Financials are based on the most recent Mortgage that was taken out on this home.
Original Mortgage
$40,000
Interest Rate
7.63%
Mortgage Type
Unknown
Create a Home Valuation Report for This Property
The Home Valuation Report is an in-depth analysis detailing your home's value as well as a comparison with similar homes in the area
Home Values in the Area
Average Home Value in this Area
Purchase History
| Date | Buyer | Sale Price | Title Company |
|---|---|---|---|
| Venter Jonathan S | $129,000 | -- | |
| Venter Jonathan S | $129,000 | -- | |
| Yalartai Harmon D | $50,000 | -- |
Source: Public Records
Mortgage History
| Date | Status | Borrower | Loan Amount |
|---|---|---|---|
| Open | Yalartai Harmon D | $116,100 | |
| Closed | Yalartai Harmon D | $116,100 | |
| Previous Owner | Yalartai Harmon D | $40,000 |
Source: Public Records
Tax History Compared to Growth
Tax History
| Year | Tax Paid | Tax Assessment Tax Assessment Total Assessment is a certain percentage of the fair market value that is determined by local assessors to be the total taxable value of land and additions on the property. | Land | Improvement |
|---|---|---|---|---|
| 2025 | $9,207 | $266,630 | $58,590 | $208,040 |
| 2024 | $8,182 | $168,630 | $40,600 | $128,030 |
| 2023 | $7,843 | $168,630 | $40,600 | $128,030 |
| 2022 | $7,690 | $168,630 | $40,600 | $128,030 |
| 2021 | $7,690 | $168,630 | $40,600 | $128,030 |
| 2020 | $7,027 | $139,230 | $32,620 | $106,610 |
| 2019 | $6,776 | $139,230 | $32,620 | $106,610 |
| 2018 | $6,718 | $139,230 | $32,620 | $106,610 |
| 2017 | $6,357 | $139,230 | $32,620 | $106,610 |
| 2016 | $6,343 | $139,230 | $32,620 | $106,610 |
| 2015 | $6,011 | $148,960 | $36,400 | $112,560 |
| 2014 | $5,973 | $148,960 | $36,400 | $112,560 |
Source: Public Records
Map
Nearby Homes
- 897 1st Ave
- 155 Lamson St
- 57 Alling Street Extension
- 93 Spring St
- 43 Clifton St
- 14 Homestead Ave
- 104 Terrace Ave
- 14 Ely St
- 22 Thill St
- 161 W Spring St Unit B2
- 81 Homeside Ave
- 170 Wood St
- 49 Glade St Unit A4
- 38 Chauncey St
- 677 Washington Ave
- 524 1st Ave
- 194 Homeside Ave
- 47,47R,63,65R Coleman St
- 194 Ella T Grasso Blvd
- 70 Coleman St