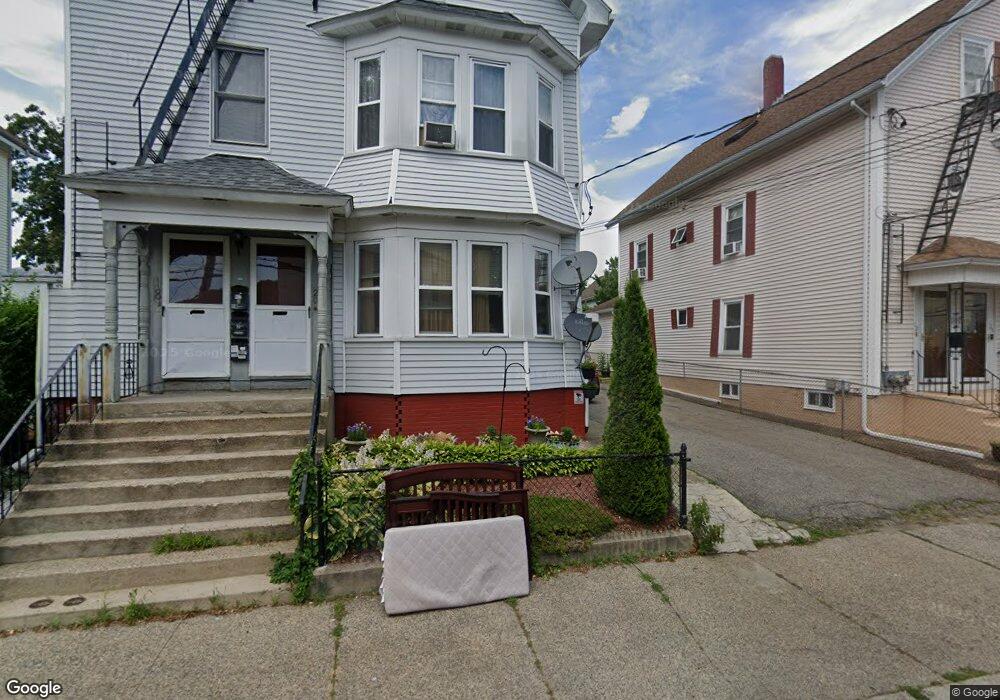
18 Amey St Pawtucket, RI 02860
Pleasant View NeighborhoodEstimated Value: $384,889 - $613,000
4
Beds
3
Baths
2,595
Sq Ft
$206/Sq Ft
Est. Value
About This Home
This home is located at 18 Amey St, Pawtucket, RI 02860 and is currently estimated at $534,472, approximately $205 per square foot. 18 Amey St is a home located in Providence County with nearby schools including St Cecilia School and Saint Raphael Academy.
Ownership History
Date
Name
Owned For
Owner Type
Purchase Details
Closed on
Oct 17, 2017
Sold by
Chingo Alabino
Bought by
Chingo Albino and Morillo Eneida
Current Estimated Value
Purchase Details
Closed on
Jun 28, 2002
Sold by
Semedo Alberto
Bought by
Chingo Albino
Purchase Details
Closed on
May 15, 1995
Sold by
Bradley Catherine Mary and Laffey Martharose
Bought by
Semedo Alberto
Create a Home Valuation Report for This Property
The Home Valuation Report is an in-depth analysis detailing your home's value as well as a comparison with similar homes in the area
Home Values in the Area
Average Home Value in this Area
Purchase History
| Date | Buyer | Sale Price | Title Company |
|---|---|---|---|
| Chingo Albino | -- | -- | |
| Chingo Albino | $139,000 | -- | |
| Semedo Alberto | $83,000 | -- |
Source: Public Records
Mortgage History
| Date | Status | Borrower | Loan Amount |
|---|---|---|---|
| Previous Owner | Semedo Alberto | $30,000 | |
| Previous Owner | Semedo Alberto | $15,000 | |
| Previous Owner | Semedo Alberto | $170,000 | |
| Previous Owner | Semedo Alberto | $131,442 |
Source: Public Records
Tax History Compared to Growth
Tax History
| Year | Tax Paid | Tax Assessment Tax Assessment Total Assessment is a certain percentage of the fair market value that is determined by local assessors to be the total taxable value of land and additions on the property. | Land | Improvement |
|---|---|---|---|---|
| 2025 | $6,504 | $494,600 | $127,400 | $367,200 |
| 2024 | $6,103 | $494,600 | $127,400 | $367,200 |
| 2023 | $5,260 | $310,500 | $64,000 | $246,500 |
| 2022 | $5,148 | $310,500 | $64,000 | $246,500 |
| 2021 | $5,148 | $310,500 | $64,000 | $246,500 |
| 2020 | $4,170 | $199,600 | $47,200 | $152,400 |
| 2019 | $4,170 | $199,600 | $47,200 | $152,400 |
| 2018 | $4,018 | $199,600 | $47,200 | $152,400 |
| 2017 | $3,817 | $168,000 | $41,000 | $127,000 |
| 2016 | $3,678 | $168,000 | $41,000 | $127,000 |
| 2015 | $3,678 | $168,000 | $41,000 | $127,000 |
| 2014 | $2,940 | $127,500 | $41,000 | $86,500 |
Source: Public Records
Map
Nearby Homes
- 27 Collins Ave
- 39 Webster St Unit 204
- 147 Coyle Ave
- 79 Turner St
- 1 Allenson Ave
- 37 Turner St
- 50 Carnation St Unit 2
- 91 Greenwich St
- 179 Columbine Ave
- 211 Carnation St
- 54 Sabin St
- 19 Lodi St
- 27 Aiken St
- 61 Mendon Rd
- 300 Front St Unit 105
- 168 Central Ave
- 176 Central Ave
- 207 Benefit St
- 0 New Haven St
- 18 Newton St