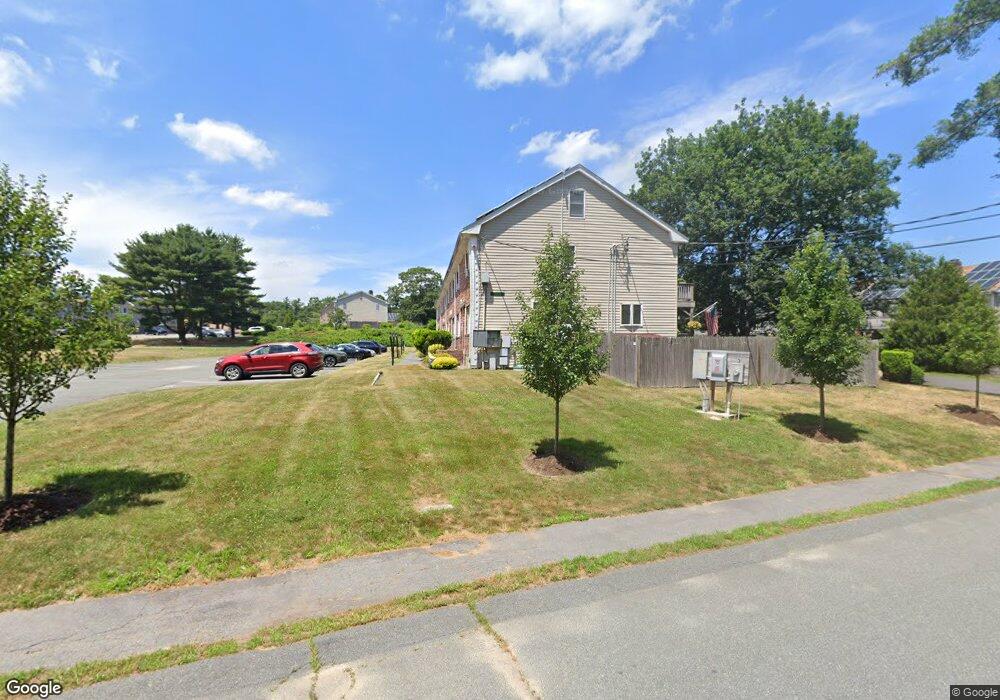
18 Andrew Rd East Bridgewater, MA 02333
Estimated Value: $360,000 - $375,000
2
Beds
2
Baths
1,024
Sq Ft
$359/Sq Ft
Est. Value
About This Home
This home is located at 18 Andrew Rd, East Bridgewater, MA 02333 and is currently estimated at $368,043, approximately $359 per square foot. 18 Andrew Rd is a home located in Plymouth County with nearby schools including Gordon W Mitchell Middle School and East Bridgewater Jr./Sr. High School.
Ownership History
Date
Name
Owned For
Owner Type
Purchase Details
Closed on
Nov 19, 2015
Sold by
Libby Mark F and Libby Cathleen A
Bought by
Turner Lisa
Current Estimated Value
Home Financials for this Owner
Home Financials are based on the most recent Mortgage that was taken out on this home.
Original Mortgage
$162,960
Outstanding Balance
$128,176
Interest Rate
3.79%
Mortgage Type
New Conventional
Estimated Equity
$239,867
Purchase Details
Closed on
Jun 1, 2005
Sold by
Foley Edith M and Comperchio Edith M
Bought by
Libby Mark F
Home Financials for this Owner
Home Financials are based on the most recent Mortgage that was taken out on this home.
Original Mortgage
$211,850
Interest Rate
5.83%
Mortgage Type
Purchase Money Mortgage
Purchase Details
Closed on
Apr 28, 2000
Sold by
Hickson Gail A
Bought by
Comperchio Edith M
Purchase Details
Closed on
Oct 29, 1993
Sold by
Barca Jeffrey A and Barca Cheryl A
Bought by
Hickson Gail A
Purchase Details
Closed on
Nov 12, 1987
Sold by
Wood Claire L
Bought by
Barca Jeffrey A
Create a Home Valuation Report for This Property
The Home Valuation Report is an in-depth analysis detailing your home's value as well as a comparison with similar homes in the area
Home Values in the Area
Average Home Value in this Area
Purchase History
| Date | Buyer | Sale Price | Title Company |
|---|---|---|---|
| Turner Lisa | $168,000 | -- | |
| Libby Mark F | $223,000 | -- | |
| Comperchio Edith M | $124,900 | -- | |
| Hickson Gail A | $80,000 | -- | |
| Barca Jeffrey A | $126,900 | -- |
Source: Public Records
Mortgage History
| Date | Status | Borrower | Loan Amount |
|---|---|---|---|
| Open | Turner Lisa | $162,960 | |
| Previous Owner | Barca Jeffrey A | $211,850 | |
| Previous Owner | Barca Jeffrey A | $123,500 | |
| Previous Owner | Barca Jeffrey A | $124,950 |
Source: Public Records
Tax History Compared to Growth
Tax History
| Year | Tax Paid | Tax Assessment Tax Assessment Total Assessment is a certain percentage of the fair market value that is determined by local assessors to be the total taxable value of land and additions on the property. | Land | Improvement |
|---|---|---|---|---|
| 2025 | $4,132 | $302,300 | $0 | $302,300 |
| 2024 | $3,921 | $283,300 | $0 | $283,300 |
| 2023 | $3,682 | $254,800 | $0 | $254,800 |
| 2022 | $3,515 | $225,300 | $0 | $225,300 |
| 2021 | $3,395 | $199,100 | $0 | $199,100 |
| 2020 | $3,359 | $194,300 | $0 | $194,300 |
| 2019 | $3,156 | $179,700 | $0 | $179,700 |
| 2018 | $2,947 | $164,100 | $0 | $164,100 |
| 2017 | $2,758 | $150,700 | $0 | $150,700 |
| 2016 | $2,630 | $144,800 | $0 | $144,800 |
| 2015 | $2,726 | $153,500 | $0 | $153,500 |
| 2014 | $2,616 | $150,600 | $0 | $150,600 |
Source: Public Records
Map
Nearby Homes
- 1 Robins St Unit 1
- 96 Trailwood Dr
- 24 High Pond Dr
- 67 Country Dr
- 23 Stone Meadow Dr
- 1993 Washington St
- 114 Plain St
- 148 Lot 1a Elm St
- 1 Lamppost Dr
- 74 Magnolia Way
- 10 Eliab Latham Way
- Lot 1 Mill St
- 780 Old Plymouth St
- 4 Sycamore Ln
- 477 Cherry St
- 0 Three Rivers Dr
- 2 Lydon Ln Unit A1
- 199 Cherry St
- 865 Plymouth St Unit 865
- 26 Old Summit St
- 32 Andrew Rd
- 30 Andrew Rd
- 28 Andrew Rd
- 26 Andrew Rd
- 24 Andrew Rd
- 22 Andrew Rd
- 20 Andrew Rd
- 20 Andrew Rd Unit 20
- 18 Andrew Rd Unit 18
- 31 Douglas Dr
- 29 Douglas Dr
- 27 Douglas Dr
- 25 Douglas Dr
- 23 Douglas Dr
- 21 Douglas Dr
- 19 Douglas Dr
- 17 Douglas Dr
- 17 Douglas Dr Unit 17
- 31 Douglas Dr Unit 104/31
- 31 Douglas Dr Unit 31