Estimated Value: $203,000 - $259,000
2
Beds
2
Baths
--
Sq Ft
0.34
Acres
About This Home
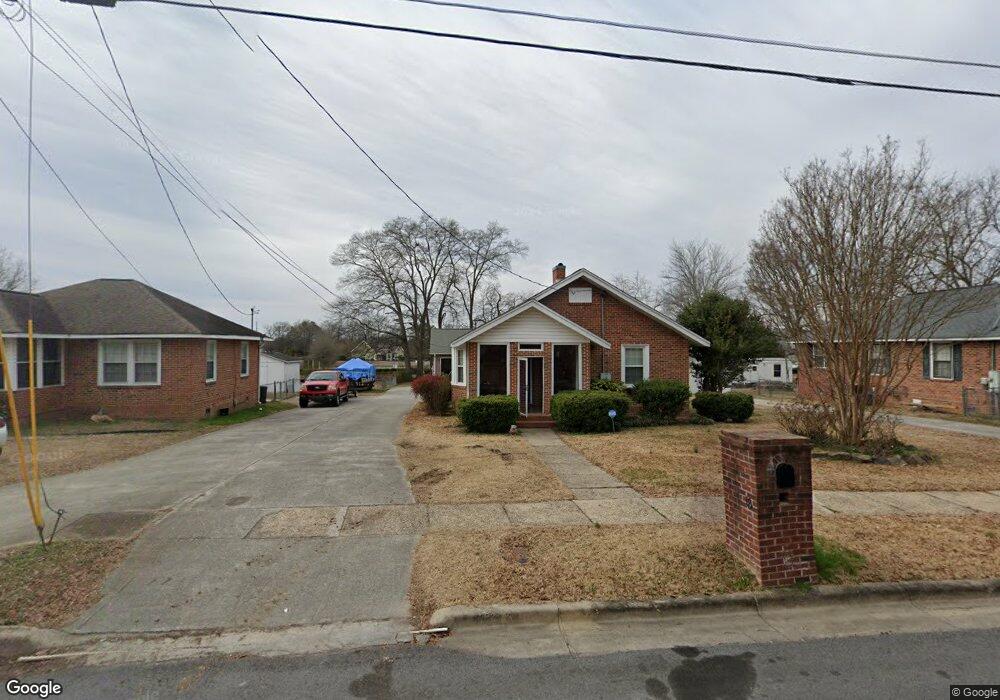
This home is located at 18 Ash St NE, Rome, GA 30161 and is currently estimated at $225,106. 18 Ash St NE is a home located in Floyd County with nearby schools including Model Middle School, Model High School, and Unity Christian School.
Ownership History
Date
Name
Owned For
Owner Type
Purchase Details
Closed on
Apr 1, 2015
Sold by
Green Louise R
Bought by
Green Louise R and Todd Green M
Current Estimated Value
Purchase Details
Closed on
Jan 5, 2015
Sold by
Green Joseph D
Bought by
Green Louise R
Purchase Details
Closed on
Mar 24, 2004
Sold by
Perry Perry H and Perry Carolyn W
Bought by
Green Joseph D and Green Louise R
Purchase Details
Closed on
Apr 12, 2000
Sold by
Gosnell Frances R
Bought by
Perry Perry H and Perry Carolyn W
Purchase Details
Closed on
Mar 8, 2000
Bought by
P and R
Purchase Details
Closed on
Feb 25, 2000
Bought by
P and R
Purchase Details
Closed on
Jan 13, 1997
Sold by
Allen Oscar L and Allen Idell J
Bought by
Allen Elizabeth Idell A and Allen K
Purchase Details
Closed on
Jul 1, 1969
Sold by
Spurlin Frank and Spurlin Edna
Bought by
Allen Oscar L and Allen Idell J
Purchase Details
Closed on
Dec 3, 1965
Sold by
Quarles Raymond C and Quarles Bessie H
Bought by
Spurlin Frank and Spurlin Edna
Purchase Details
Closed on
Jan 1, 1901
Bought by
Quarles Raymond C and Quarles Bessie H
Create a Home Valuation Report for This Property
The Home Valuation Report is an in-depth analysis detailing your home's value as well as a comparison with similar homes in the area
Home Values in the Area
Average Home Value in this Area
Purchase History
| Date | Buyer | Sale Price | Title Company |
|---|---|---|---|
| Green Louise R | -- | -- | |
| Green Louise R | -- | -- | |
| Green Joseph D | $63,000 | -- | |
| Perry Perry H | $60,000 | -- | |
| Gosnell Frances R | -- | -- | |
| P | -- | -- | |
| P | -- | -- | |
| Allen Elizabeth Idell A | -- | -- | |
| Allen Oscar L | $13,500 | -- | |
| Spurlin Frank | $11,000 | -- | |
| Quarles Raymond C | -- | -- |
Source: Public Records
Tax History Compared to Growth
Tax History
| Year | Tax Paid | Tax Assessment Tax Assessment Total Assessment is a certain percentage of the fair market value that is determined by local assessors to be the total taxable value of land and additions on the property. | Land | Improvement |
|---|---|---|---|---|
| 2024 | $3,663 | $117,481 | $15,276 | $102,205 |
| 2023 | $3,401 | $106,516 | $13,807 | $92,709 |
| 2022 | $1,242 | $72,152 | $11,457 | $60,695 |
| 2021 | $1,144 | $65,473 | $10,575 | $54,898 |
| 2020 | $1,119 | $60,179 | $8,078 | $52,101 |
| 2019 | $1,033 | $55,528 | $8,078 | $47,450 |
| 2018 | $999 | $52,812 | $8,078 | $44,734 |
| 2017 | $982 | $51,236 | $8,078 | $43,158 |
| 2016 | $986 | $50,240 | $7,480 | $42,760 |
| 2015 | $1,225 | $52,680 | $3,800 | $48,880 |
| 2014 | $1,225 | $59,023 | $3,800 | $55,223 |
Source: Public Records
Map
Nearby Homes
- 7 Ash St NE
- 1 Fir St NE
- 0 Cypress St NE Unit 7494593
- 0 Cypress St NE Unit 10422946
- 42 Dogwood St NE
- 40 Dogwood St NE
- 23 Oak St NE
- 27 Oak St NE
- 205 Couper St NE
- 0 Euclid Ave Unit 10617853
- 311 Reynolds St NE
- 541 Reece St NE
- 2 Lindberg Dr NE
- 219 North Ave NE
- 411 Woodward St NE
- 7 Roseway Cir NE
- 3 Roseway Cir NE
- 302 Tolbert St
- 23 Reece St NE
- 11 Pine St NE
- 16 Ash St NE
- 20 Ash St NE
- 14 Ash St NE
- 22 Ash St NE
- 0 J L Todd Dr
- 12 Ash St NE
- 1 Ash St NE
- 15 26 J L Todd Dr
- 3 Ash St NE
- 2 Beech St NE
- 10 Ash St NE
- 4 Beech St NE
- 1601 J L Todd Dr Unit LOT 6
- 6 Beech St NE
- 1701 J L Todd Dr Unit LOT 5
- 8 Ash St NE
- 8 Ash St NE
- 8 Ash St NE Unit 8&9
- 8 Ash St NE Unit 8&9
- 8 Ash St NE