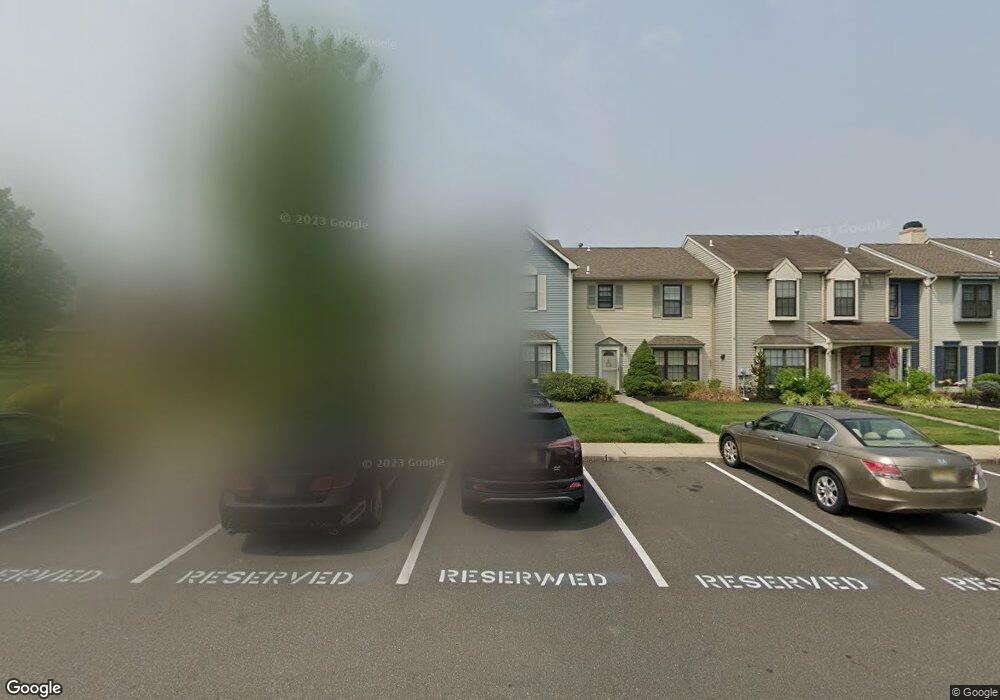
18 Banbury Ct Trenton, NJ 08691
Estimated Value: $353,850 - $484,000
--
Bed
--
Bath
1,220
Sq Ft
$330/Sq Ft
Est. Value
About This Home
This home is located at 18 Banbury Ct, Trenton, NJ 08691 and is currently estimated at $402,963, approximately $330 per square foot. 18 Banbury Ct is a home located in Mercer County with nearby schools including Sharon Elementary School, Pond Road Middle School, and Robbinsville High School.
Ownership History
Date
Name
Owned For
Owner Type
Purchase Details
Closed on
Nov 30, 1995
Sold by
Farrell Marie E
Bought by
Piscione Dennis and Piscione Margarget
Current Estimated Value
Home Financials for this Owner
Home Financials are based on the most recent Mortgage that was taken out on this home.
Original Mortgage
$63,000
Outstanding Balance
$1,298
Interest Rate
7.44%
Mortgage Type
Purchase Money Mortgage
Estimated Equity
$401,665
Create a Home Valuation Report for This Property
The Home Valuation Report is an in-depth analysis detailing your home's value as well as a comparison with similar homes in the area
Home Values in the Area
Average Home Value in this Area
Purchase History
| Date | Buyer | Sale Price | Title Company |
|---|---|---|---|
| Piscione Dennis | $97,000 | -- |
Source: Public Records
Mortgage History
| Date | Status | Borrower | Loan Amount |
|---|---|---|---|
| Open | Piscione Dennis | $63,000 |
Source: Public Records
Tax History Compared to Growth
Tax History
| Year | Tax Paid | Tax Assessment Tax Assessment Total Assessment is a certain percentage of the fair market value that is determined by local assessors to be the total taxable value of land and additions on the property. | Land | Improvement |
|---|---|---|---|---|
| 2025 | $7,025 | $210,200 | $108,200 | $102,000 |
| 2024 | $6,556 | $210,200 | $108,200 | $102,000 |
| 2023 | $6,556 | $210,200 | $108,200 | $102,000 |
| 2022 | $6,302 | $210,200 | $108,200 | $102,000 |
| 2021 | $6,211 | $210,200 | $108,200 | $102,000 |
| 2020 | $6,214 | $210,200 | $108,200 | $102,000 |
| 2019 | $6,216 | $210,200 | $108,200 | $102,000 |
| 2018 | $6,176 | $210,200 | $108,200 | $102,000 |
| 2017 | $6,163 | $210,200 | $108,200 | $102,000 |
| 2016 | $6,106 | $210,200 | $108,200 | $102,000 |
| 2015 | $6,014 | $210,200 | $108,200 | $102,000 |
| 2014 | $6,035 | $210,200 | $108,200 | $102,000 |
Source: Public Records
Map
Nearby Homes