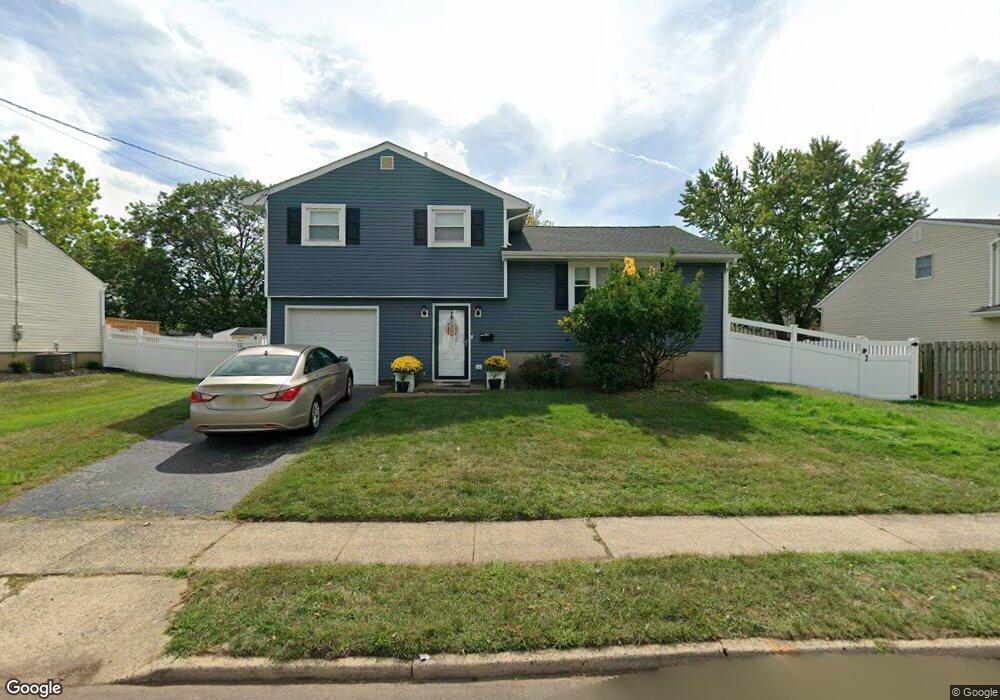
18 Barlow Rd Edison, NJ 08817
Estimated Value: $445,000 - $686,000
Studio
--
Bath
1,377
Sq Ft
$404/Sq Ft
Est. Value
About This Home
This home is located at 18 Barlow Rd, Edison, NJ 08817 and is currently estimated at $556,175, approximately $403 per square foot. 18 Barlow Rd is a home located in Middlesex County with nearby schools including John Marshall Elementary School, Thomas Jefferson Middle School, and Edison High School.
Ownership History
Date
Name
Owned For
Owner Type
Purchase Details
Closed on
Apr 21, 2021
Sold by
Previte Carol and Estate Of Theresa Skrobick
Bought by
Previte Eric M and Foster Shalay B
Current Estimated Value
Home Financials for this Owner
Home Financials are based on the most recent Mortgage that was taken out on this home.
Original Mortgage
$153,000
Outstanding Balance
$138,361
Interest Rate
3.1%
Mortgage Type
New Conventional
Estimated Equity
$417,814
Create a Home Valuation Report for This Property
The Home Valuation Report is an in-depth analysis detailing your home's value as well as a comparison with similar homes in the area
Home Values in the Area
Average Home Value in this Area
Purchase History
| Date | Buyer | Sale Price | Title Company |
|---|---|---|---|
| Previte Eric M | $191,500 | Westcor Land Title Ins Co |
Source: Public Records
Mortgage History
| Date | Status | Borrower | Loan Amount |
|---|---|---|---|
| Open | Previte Eric M | $153,000 |
Source: Public Records
Tax History
| Year | Tax Paid | Tax Assessment Tax Assessment Total Assessment is a certain percentage of the fair market value that is determined by local assessors to be the total taxable value of land and additions on the property. | Land | Improvement |
|---|---|---|---|---|
| 2025 | $10,162 | $170,700 | $95,000 | $75,700 |
| 2024 | $10,107 | $170,700 | $95,000 | $75,700 |
| 2023 | $10,107 | $170,700 | $95,000 | $75,700 |
| 2022 | $9,210 | $155,500 | $95,000 | $60,500 |
| 2021 | $9,179 | $155,500 | $95,000 | $60,500 |
| 2020 | $9,095 | $155,500 | $95,000 | $60,500 |
| 2019 | $6,961 | $155,500 | $95,000 | $60,500 |
| 2018 | $7,615 | $155,500 | $95,000 | $60,500 |
| 2017 | $7,270 | $155,500 | $95,000 | $60,500 |
| 2016 | $8,204 | $155,500 | $95,000 | $60,500 |
| 2015 | $7,390 | $155,500 | $95,000 | $60,500 |
| 2014 | $7,160 | $155,500 | $95,000 | $60,500 |
Source: Public Records
Map
Nearby Homes
- 239 Suttons Ln
- 2 Clark Ave
- 20 Clark Ave
- 31 Highway Terrace
- 7 Vale St
- 61 Duley Ave
- 1711 Central Ave
- 271 Central Ave
- 9 Rolfe Ave
- 449 Plainfield Ave
- 225 Penn Ave
- 111 Barnard St
- 14 Amherst St
- 223 Plainfield Ave
- 62 Hillcrest Ave
- 27 Sheppard Place
- 65 Orange St
- 47 Hillcrest Ave
- 46 Runyon Ave
- 477 Lincoln Ave
Your Personal Tour Guide
Ask me questions while you tour the home.