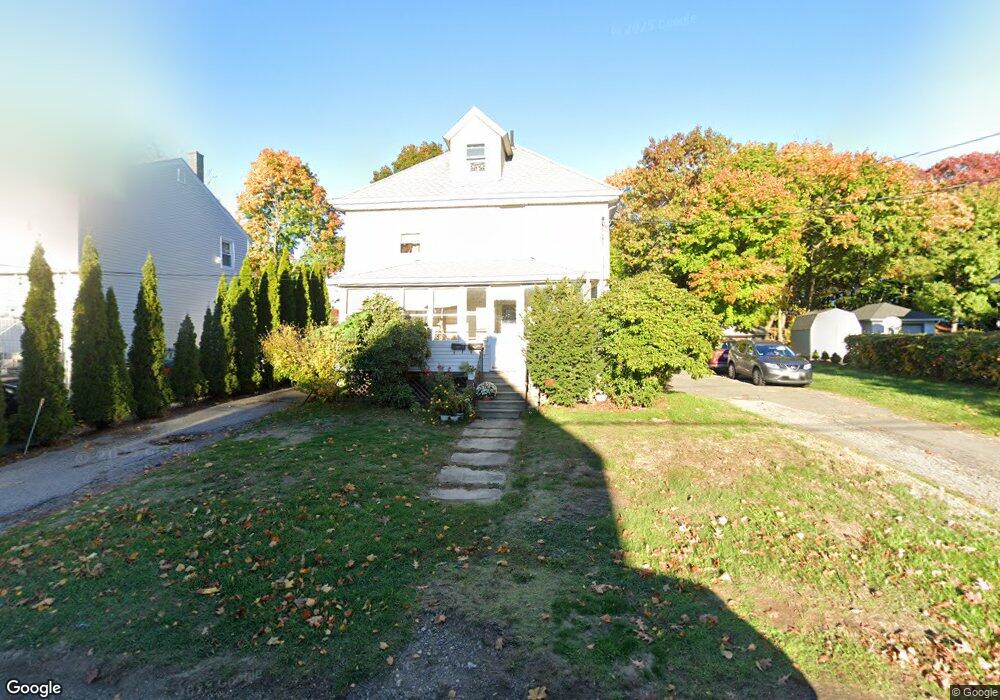
18 Beech St Reading, MA 01867
Estimated Value: $773,199 - $1,012,000
4
Beds
2
Baths
2,624
Sq Ft
$341/Sq Ft
Est. Value
About This Home
This home is located at 18 Beech St, Reading, MA 01867 and is currently estimated at $893,800, approximately $340 per square foot. 18 Beech St is a home located in Middlesex County with nearby schools including J. Warren Killam Elementary School, Walter S. Parker Middle School, and Reading Memorial High School.
Ownership History
Date
Name
Owned For
Owner Type
Purchase Details
Closed on
Sep 13, 2002
Sold by
Subulkin Jay
Bought by
Denham Dale F
Current Estimated Value
Home Financials for this Owner
Home Financials are based on the most recent Mortgage that was taken out on this home.
Original Mortgage
$300,000
Interest Rate
6.48%
Mortgage Type
Purchase Money Mortgage
Purchase Details
Closed on
Jun 4, 1987
Sold by
Sullivan Michael L
Bought by
Sibulkin Jay R
Create a Home Valuation Report for This Property
The Home Valuation Report is an in-depth analysis detailing your home's value as well as a comparison with similar homes in the area
Home Values in the Area
Average Home Value in this Area
Purchase History
| Date | Buyer | Sale Price | Title Company |
|---|---|---|---|
| Denham Dale F | $403,000 | -- | |
| Sibulkin Jay R | $227,000 | -- |
Source: Public Records
Mortgage History
| Date | Status | Borrower | Loan Amount |
|---|---|---|---|
| Open | Sibulkin Jay R | $267,600 | |
| Closed | Denham Dale F | $300,000 | |
| Previous Owner | Sibulkin Jay R | $384,000 |
Source: Public Records
Tax History
| Year | Tax Paid | Tax Assessment Tax Assessment Total Assessment is a certain percentage of the fair market value that is determined by local assessors to be the total taxable value of land and additions on the property. | Land | Improvement |
|---|---|---|---|---|
| 2025 | $7,676 | $673,900 | $420,500 | $253,400 |
| 2024 | $7,429 | $633,900 | $395,400 | $238,500 |
| 2023 | $8,403 | $667,400 | $360,900 | $306,500 |
| 2022 | $7,747 | $581,200 | $313,800 | $267,400 |
| 2021 | $7,594 | $549,900 | $287,500 | $262,400 |
| 2020 | $4,571 | $523,600 | $273,600 | $250,000 |
| 2019 | $7,106 | $499,400 | $260,800 | $238,600 |
| 2018 | $6,476 | $466,900 | $243,700 | $223,200 |
| 2017 | $4,370 | $448,100 | $231,900 | $216,200 |
| 2016 | $6,345 | $437,600 | $265,500 | $172,100 |
| 2015 | $6,152 | $418,500 | $245,400 | $173,100 |
| 2014 | $6,011 | $407,800 | $237,100 | $170,700 |
Source: Public Records
Map
Nearby Homes
- 48 Village St Unit 1001
- 50 Quannapowitt Pkwy
- 41 Winter St
- 269 Main St Unit 4001
- 141 Belmont St
- 241 Main St Unit C3
- 20 Pinevale Ave
- 90 Sunnyside Ave
- 5 Washington St Unit D4
- 5 Washington St Unit A5
- 27 Audubon Rd
- 44 Grandview Rd
- 1 Pennsylvania Ave
- 1 Summit Dr Unit 57
- 311 Gazebo Cir Unit 311
- 1014 Gazebo Cir Unit 1014
- 75 Hopkins St
- 270 Lowell St
- 29 Cordis St
- 95 Prospect St
Your Personal Tour Guide
Ask me questions while you tour the home.