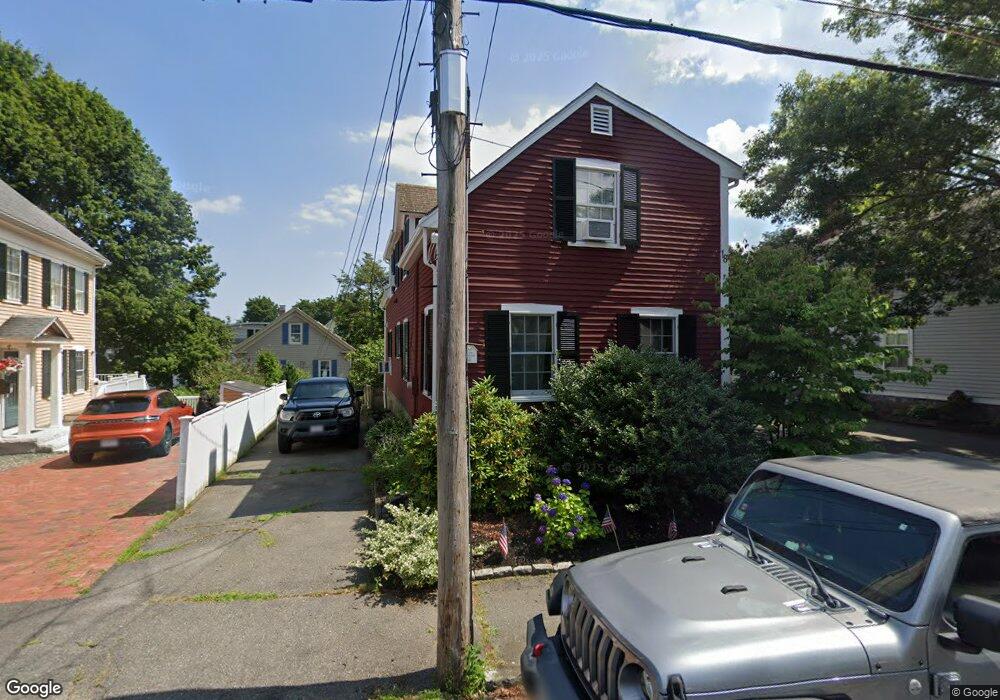
18 Bowden St Marblehead, MA 01945
Estimated Value: $892,165 - $1,031,000
3
Beds
2
Baths
1,574
Sq Ft
$613/Sq Ft
Est. Value
About This Home
This home is located at 18 Bowden St, Marblehead, MA 01945 and is currently estimated at $964,541, approximately $612 per square foot. 18 Bowden St is a home located in Essex County with nearby schools including Marblehead High School, Marblehead Community Charter Public School, and Devereux School.
Ownership History
Date
Name
Owned For
Owner Type
Purchase Details
Closed on
Jun 15, 2007
Sold by
Keaney Kelly A and Keaney Mark W
Bought by
Boyd Andrew J
Current Estimated Value
Purchase Details
Closed on
Dec 1, 1999
Sold by
Zonnenberg Jan P and Zonnenberg Patricia K
Bought by
Keaney Mark W
Purchase Details
Closed on
Dec 11, 1998
Sold by
Hawley St Rt
Bought by
Cabrera Nelson B
Purchase Details
Closed on
May 15, 1997
Sold by
Johnston David B and Johnston Patricia G
Bought by
Zonnenberg Jan Paul
Purchase Details
Closed on
Jun 22, 1993
Sold by
Homan Walter E and Homan Susan R
Bought by
Johnston David B
Create a Home Valuation Report for This Property
The Home Valuation Report is an in-depth analysis detailing your home's value as well as a comparison with similar homes in the area
Home Values in the Area
Average Home Value in this Area
Purchase History
| Date | Buyer | Sale Price | Title Company |
|---|---|---|---|
| Boyd Andrew J | $535,000 | -- | |
| Boyd Andrew J | $535,000 | -- | |
| Keaney Mark W | $380,000 | -- | |
| Keaney Mark W | $380,000 | -- | |
| Cabrera Nelson B | $90,000 | -- | |
| Cabrera Nelson B | $90,000 | -- | |
| Zonnenberg Jan Paul | $294,000 | -- | |
| Zonnenberg Jan Paul | $294,000 | -- | |
| Johnston David B | $236,500 | -- | |
| Johnston David B | $236,500 | -- |
Source: Public Records
Mortgage History
| Date | Status | Borrower | Loan Amount |
|---|---|---|---|
| Open | Johnston David B | $408,000 |
Source: Public Records
Tax History
| Year | Tax Paid | Tax Assessment Tax Assessment Total Assessment is a certain percentage of the fair market value that is determined by local assessors to be the total taxable value of land and additions on the property. | Land | Improvement |
|---|---|---|---|---|
| 2025 | $7,917 | $874,800 | $533,300 | $341,500 |
| 2024 | $7,529 | $840,300 | $509,600 | $330,700 |
| 2023 | $7,516 | $751,600 | $485,800 | $265,800 |
| 2022 | $6,916 | $657,400 | $397,000 | $260,400 |
| 2021 | $6,627 | $636,000 | $379,200 | $256,800 |
| 2020 | $6,445 | $620,300 | $379,200 | $241,100 |
| 2019 | $6,261 | $583,000 | $343,700 | $239,300 |
| 2018 | $6,043 | $548,400 | $320,000 | $228,400 |
| 2017 | $5,646 | $512,800 | $284,400 | $228,400 |
| 2016 | $5,623 | $506,600 | $272,600 | $234,000 |
| 2015 | $5,481 | $494,700 | $260,700 | $234,000 |
| 2014 | $4,948 | $446,200 | $225,200 | $221,000 |
Source: Public Records
Map
Nearby Homes
- 6 Mount Vernon St
- 290 Washington St Unit A
- 66 Pleasant St Unit 1
- 66 Pleasant St Unit 2
- 132 Elm St
- 132 Elm St Unit 132
- 30 Haley Rd Unit 1
- 26 Summer St Unit 1
- 45 Pleasant St
- 55 Brackett Place Unit B
- 70 Maverick St
- 23 Wyman Rd
- 9 Darling St
- 3 Frost Ln Unit 1
- 7 Mechanic Ct
- 1 Knollwood Rd
- 282 Pleasant St
- 4 Gallison Ave
- 21 Kenneth Rd
- 4 Ballast Ln
Your Personal Tour Guide
Ask me questions while you tour the home.