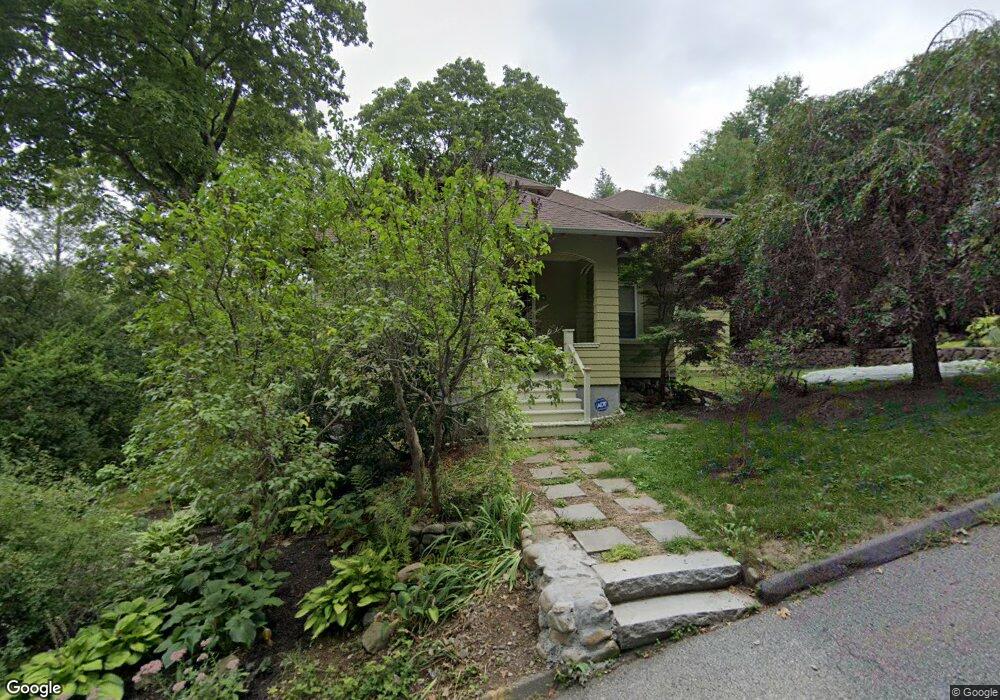
18 Bowker St Lexington, MA 02421
East Lexington NeighborhoodEstimated Value: $824,000 - $1,283,000
4
Beds
2
Baths
1,186
Sq Ft
$934/Sq Ft
Est. Value
About This Home
This home is located at 18 Bowker St, Lexington, MA 02421 and is currently estimated at $1,108,069, approximately $934 per square foot. 18 Bowker St is a home located in Middlesex County with nearby schools including Bowman Elementary School, Jonas Clarke Middle School, and Lexington High School.
Ownership History
Date
Name
Owned For
Owner Type
Purchase Details
Closed on
Mar 25, 2005
Sold by
Masters Joellen M and Nezam-Mafi Mohammad T
Bought by
Masters Joellen M and Mezam-Mafi Mohammad T
Current Estimated Value
Purchase Details
Closed on
Jul 13, 2001
Sold by
Hebert Leroy J and Hebert Helen D
Bought by
Nezam-Mafi Mohammad and Masters Joellen M
Home Financials for this Owner
Home Financials are based on the most recent Mortgage that was taken out on this home.
Original Mortgage
$150,000
Interest Rate
7.2%
Mortgage Type
Purchase Money Mortgage
Create a Home Valuation Report for This Property
The Home Valuation Report is an in-depth analysis detailing your home's value as well as a comparison with similar homes in the area
Home Values in the Area
Average Home Value in this Area
Purchase History
| Date | Buyer | Sale Price | Title Company |
|---|---|---|---|
| Masters Joellen M | -- | -- | |
| Nezam-Mafi Mohammad | $387,000 | -- |
Source: Public Records
Mortgage History
| Date | Status | Borrower | Loan Amount |
|---|---|---|---|
| Previous Owner | Nezam-Mafi Mohammad | $150,000 |
Source: Public Records
Tax History
| Year | Tax Paid | Tax Assessment Tax Assessment Total Assessment is a certain percentage of the fair market value that is determined by local assessors to be the total taxable value of land and additions on the property. | Land | Improvement |
|---|---|---|---|---|
| 2025 | $13,832 | $1,131,000 | $666,000 | $465,000 |
| 2024 | $14,088 | $1,150,000 | $634,000 | $516,000 |
| 2023 | $13,312 | $1,024,000 | $577,000 | $447,000 |
| 2022 | $12,434 | $901,000 | $524,000 | $377,000 |
| 2021 | $12,491 | $868,000 | $499,000 | $369,000 |
| 2020 | $11,507 | $819,000 | $499,000 | $320,000 |
| 2019 | $11,084 | $785,000 | $475,000 | $310,000 |
| 2018 | $10,811 | $756,000 | $453,000 | $303,000 |
| 2017 | $10,433 | $720,000 | $418,000 | $302,000 |
| 2016 | $9,826 | $673,000 | $398,000 | $275,000 |
| 2015 | $9,778 | $658,000 | $362,000 | $296,000 |
| 2014 | $10,190 | $657,000 | $322,000 | $335,000 |
Source: Public Records
Map
Nearby Homes
- 82 Oak St
- 120 Massachusetts Ave Unit 120
- 4 Aerial St
- 122 Sylvia St
- 12 Arnold St
- 451 Appleton St
- 64 Browning Rd
- 20 Homer Rd
- 847 Massachusetts Ave
- 211 Florence Ave
- 32 Moon Hill Rd
- 15 Bird Hill Rd
- 991 Massachusetts Ave
- 16 Lily Pond Ln Unit 16
- 7 Park Avenue Extension
- 25 Maple St
- 53 Birch Hill Rd
- 20 Maple St
- 10 Bartlett Ave
- 0 Reed St
Your Personal Tour Guide
Ask me questions while you tour the home.