T
Seller's Agent in 2019
Tiesha Guichard
Hue Realty Group
Estimated Value: $844,000 - $1,329,000
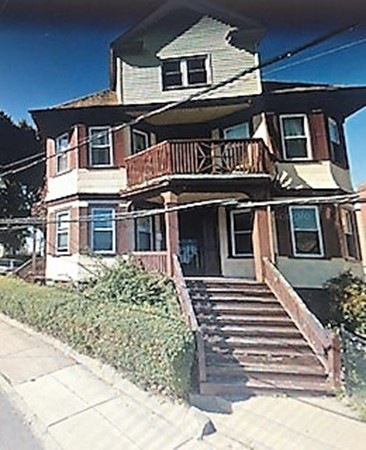
This home is located at 18 Brinsley St Unit 20, Dorchester, MA 02121 since 16 January 2018 and is currently estimated at $1,075,667, approximately $186 per square foot. This property was built in 1905. 18 Brinsley St Unit 20 is a home located in Suffolk County with nearby schools including Mother Caroline Academy & Education Center and Uncommon Schools Roxbury Prep Dorchester Campus.
Last Agent to Sell the Property
Tiesha Guichard
Hue Realty Group Listed on: 01/16/2018
Last Buyer's Agent
Tiesha Guichard
Hue Realty Group Listed on: 01/16/2018
| Date | Buyer | Sale Price | Title Company |
|---|---|---|---|
| Liriano & Sons Llc | -- | -- | |
| Liriano & Sons Llc | $247,500 | -- | |
| Dincan Anthony A Est | $81,500 | -- |
| Date | Status | Borrower | Loan Amount |
|---|---|---|---|
| Open | Liriano & Sons Llc | $450,000 |
| Date | Event | Price | List to Sale | Price per Sq Ft |
|---|---|---|---|---|
| 05/31/2019 05/31/19 | Sold | $495,000 | -10.0% | $86 / Sq Ft |
| 12/18/2018 12/18/18 | Pending | -- | -- | -- |
| 01/16/2018 01/16/18 | For Sale | $550,000 | -- | $95 / Sq Ft |
| Year | Tax Paid | Tax Assessment Tax Assessment Total Assessment is a certain percentage of the fair market value that is determined by local assessors to be the total taxable value of land and additions on the property. | Land | Improvement |
|---|---|---|---|---|
| 2025 | $9,020 | $778,900 | $244,800 | $534,100 |
| 2024 | $7,965 | $730,700 | $193,200 | $537,500 |
| 2023 | $7,132 | $664,100 | $175,600 | $488,500 |
| 2022 | $6,751 | $620,500 | $164,100 | $456,400 |
| 2021 | $6,130 | $574,500 | $151,900 | $422,600 |
| 2020 | $5,103 | $483,200 | $152,300 | $330,900 |
| 2019 | $4,627 | $439,000 | $103,500 | $335,500 |
| 2018 | $4,001 | $381,800 | $103,500 | $278,300 |
| 2017 | $4,002 | $377,900 | $103,500 | $274,400 |
| 2016 | $3,615 | $328,600 | $103,500 | $225,100 |
| 2015 | $3,784 | $312,500 | $101,300 | $211,200 |
| 2014 | $3,607 | $286,700 | $101,300 | $185,400 |
T
Seller's Agent in 2019
Tiesha Guichard
Hue Realty Group
Source: MLS Property Information Network (MLS PIN)
MLS Number: 72433720
APN: DORC-000000-000014-001075
Disclaimer: Certain information contained herein is derived from information provided by parties other than Homes.com. All information provided is deemed reliable, but is not guaranteed to be accurate and should be independently verified.
![]() The property listing data and information, or the Images, set forth herein were provided to MLS Property Information Network, Inc. from third party sources, including sellers, lessors and public records, and were compiled by MLS Property Information Network, Inc. The property listing data and information, and the Images, are for the personal, non-commercial use of consumers having a good faith interest in purchasing or leasing listed properties of the type displayed to them and may not be used for any purpose other than to identify prospective properties which such consumers may have a good faith interest in purchasing or leasing. MLS Property Information Network, Inc. and its subscribers disclaim any and all representations and warranties as to the accuracy of the property listing data and information, or as to the accuracy of any of the Images, set forth herein.
The property listing data and information, or the Images, set forth herein were provided to MLS Property Information Network, Inc. from third party sources, including sellers, lessors and public records, and were compiled by MLS Property Information Network, Inc. The property listing data and information, and the Images, are for the personal, non-commercial use of consumers having a good faith interest in purchasing or leasing listed properties of the type displayed to them and may not be used for any purpose other than to identify prospective properties which such consumers may have a good faith interest in purchasing or leasing. MLS Property Information Network, Inc. and its subscribers disclaim any and all representations and warranties as to the accuracy of the property listing data and information, or as to the accuracy of any of the Images, set forth herein.
