Estimated Value: $240,000 - $294,000
2
Beds
2
Baths
1,206
Sq Ft
$220/Sq Ft
Est. Value
About This Home
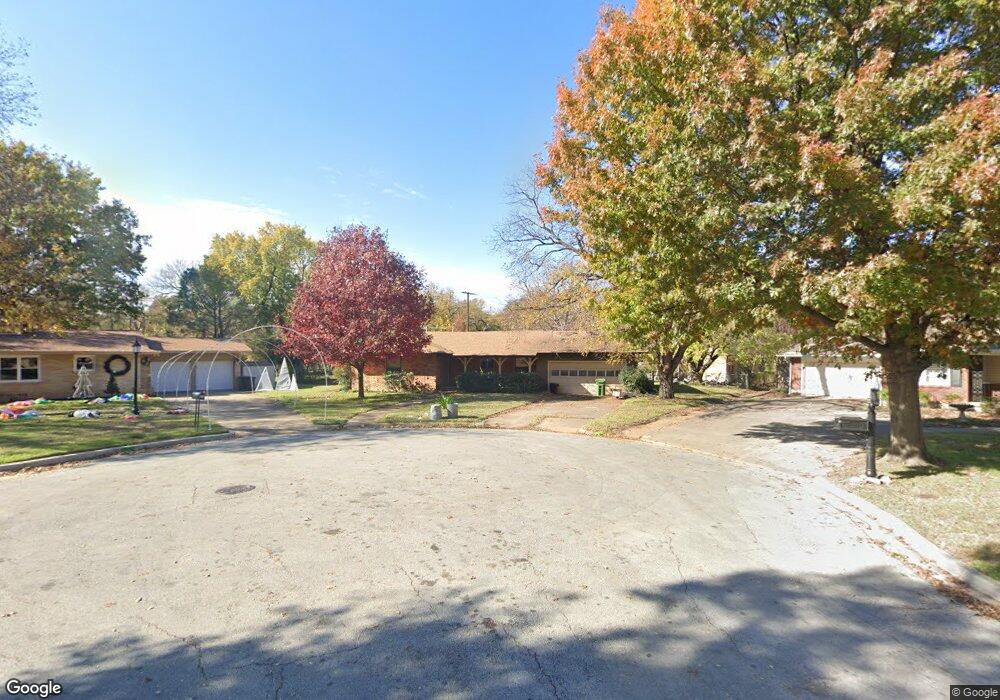
This home is located at 18 Brook Forest Ln, Hurst, TX 76053 and is currently estimated at $265,210, approximately $219 per square foot. 18 Brook Forest Ln is a home located in Tarrant County with nearby schools including West Hurst Elementary School, Hurst J High School, and L.D. Bell High School.
Ownership History
Date
Name
Owned For
Owner Type
Purchase Details
Closed on
Nov 30, 1999
Sold by
Johnson Bobby J and Johnson Elizabeth
Bought by
Blume Jennifer P
Current Estimated Value
Home Financials for this Owner
Home Financials are based on the most recent Mortgage that was taken out on this home.
Original Mortgage
$53,100
Outstanding Balance
$16,711
Interest Rate
7.93%
Estimated Equity
$248,499
Purchase Details
Closed on
Sep 26, 1997
Sold by
Harvell Lisa Irby and Blum Susan Irby
Bought by
Johnson Bobby J and Johnson Elizabeth
Home Financials for this Owner
Home Financials are based on the most recent Mortgage that was taken out on this home.
Original Mortgage
$64,928
Interest Rate
7.56%
Mortgage Type
FHA
Purchase Details
Closed on
Feb 28, 1996
Sold by
House William Leon and House Clara B
Bought by
The William Leon & Clara B House Family
Create a Home Valuation Report for This Property
The Home Valuation Report is an in-depth analysis detailing your home's value as well as a comparison with similar homes in the area
Home Values in the Area
Average Home Value in this Area
Purchase History
| Date | Buyer | Sale Price | Title Company |
|---|---|---|---|
| Blume Jennifer P | -- | Ticor Land Title | |
| Johnson Bobby J | -- | American Title Co | |
| The William Leon & Clara B House Family | -- | -- |
Source: Public Records
Mortgage History
| Date | Status | Borrower | Loan Amount |
|---|---|---|---|
| Open | Blume Jennifer P | $53,100 | |
| Previous Owner | Johnson Bobby J | $64,928 |
Source: Public Records
Tax History Compared to Growth
Tax History
| Year | Tax Paid | Tax Assessment Tax Assessment Total Assessment is a certain percentage of the fair market value that is determined by local assessors to be the total taxable value of land and additions on the property. | Land | Improvement |
|---|---|---|---|---|
| 2025 | $2,764 | $227,253 | $47,025 | $180,228 |
| 2024 | $2,764 | $227,253 | $47,025 | $180,228 |
| 2023 | $3,728 | $232,025 | $23,512 | $208,513 |
| 2022 | $3,895 | $193,501 | $23,512 | $169,989 |
| 2021 | $3,709 | $173,816 | $23,512 | $150,304 |
| 2020 | $3,363 | $141,535 | $23,512 | $118,023 |
| 2019 | $3,110 | $137,968 | $24,000 | $113,968 |
| 2018 | $2,312 | $115,531 | $14,400 | $101,131 |
| 2017 | $2,658 | $128,116 | $19,800 | $108,316 |
| 2016 | $2,416 | $112,179 | $19,800 | $92,379 |
| 2015 | $1,756 | $86,800 | $19,800 | $67,000 |
| 2014 | $1,756 | $86,800 | $19,800 | $67,000 |
Source: Public Records
Map
Nearby Homes
- 516 Hurstview Dr
- 520 W Redbud Dr
- 612 Elm St
- 708 Hurstview Dr
- 628 Elm St
- 744 Briarwood Ln
- 425 Ridgecrest Dr
- 408 Simmons Dr
- 231 Elm St
- 758 Briarwood Ln
- 741 Ponderosa Dr
- 637 Post Oak Dr
- 624 Harrison Ln
- 552 Norwood Dr
- 125 Souder Dr
- 120 Charlene Dr
- 127 W Cedar St
- 644 Caduceus Ln
- 205 Corinna Ct
- 508 Oak Park Dr
- 22 Brook Forest Ln
- 14 Brook Forest Ln
- 621 Ponderosa Dr
- 617 Ponderosa Dr
- 24 Brook Forest Ln
- 26 Brook Forest Ln
- 10 Brook Forest Ln
- 625 Ponderosa Dr
- 613 Ponderosa Dr
- 30 Brook Forest Ln
- 524 W Redbud Dr
- 516 W Redbud Dr
- 620 Ponderosa Dr
- 511 Shadowbrook Ln
- 629 Ponderosa Dr
- 512 W Redbud Dr
- 601 Oakwood Ave
- 34 Brook Forest Ln
- 609 Ponderosa Dr
- 600 W Redbud Dr