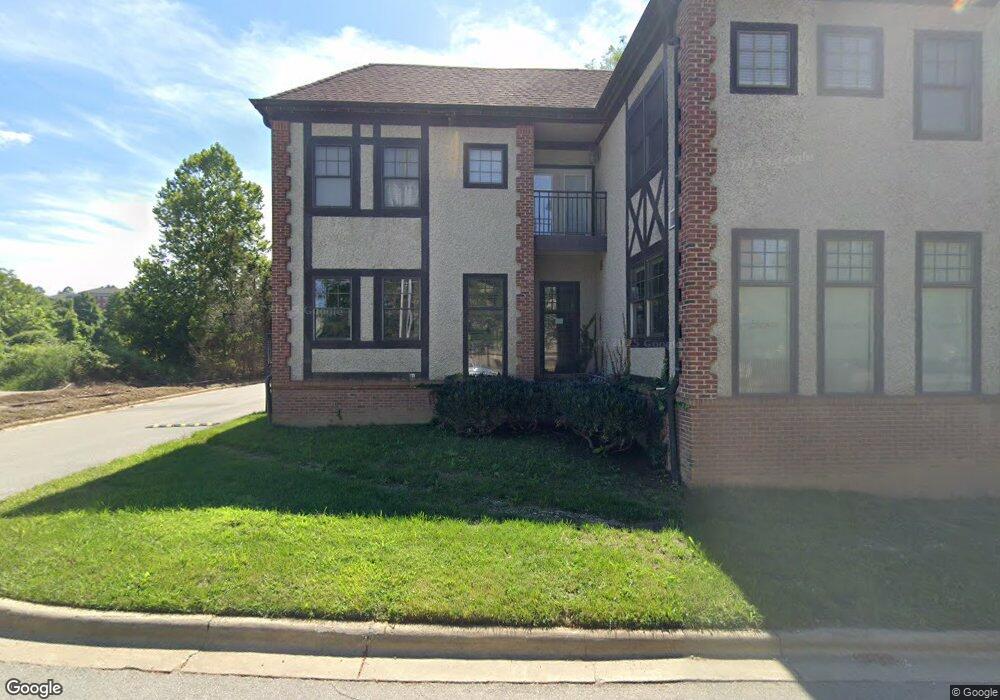
18 Brook St Unit 20 Asheville, NC 28803
Estimated Value: $366,000 - $439,000
1
Bed
1
Bath
750
Sq Ft
$518/Sq Ft
Est. Value
About This Home
This home is located at 18 Brook St Unit 20, Asheville, NC 28803 and is currently estimated at $388,692, approximately $518 per square foot. 18 Brook St Unit 20 is a home located in Buncombe County with nearby schools including A.C. Reynolds High School, Oakley Elementary, and A.C. Reynolds Middle School.
Ownership History
Date
Name
Owned For
Owner Type
Purchase Details
Closed on
Aug 1, 2022
Sold by
Candy Cook
Bought by
Quarles Elisa
Current Estimated Value
Home Financials for this Owner
Home Financials are based on the most recent Mortgage that was taken out on this home.
Original Mortgage
$389,000
Outstanding Balance
$367,502
Interest Rate
4.15%
Mortgage Type
Balloon
Estimated Equity
$21,190
Purchase Details
Closed on
Apr 10, 2019
Sold by
Cabin Michael and Cabin Annette
Bought by
Cook Candy
Purchase Details
Closed on
Nov 27, 2017
Sold by
Steinmuss Joy
Bought by
Cabin Michael and Cabin Annette
Home Financials for this Owner
Home Financials are based on the most recent Mortgage that was taken out on this home.
Original Mortgage
$153,300
Interest Rate
4.25%
Mortgage Type
Adjustable Rate Mortgage/ARM
Purchase Details
Closed on
Oct 29, 2004
Sold by
Esur Enterprises Llc
Bought by
Halleran Scott C
Home Financials for this Owner
Home Financials are based on the most recent Mortgage that was taken out on this home.
Original Mortgage
$143,000
Interest Rate
5.64%
Mortgage Type
Purchase Money Mortgage
Create a Home Valuation Report for This Property
The Home Valuation Report is an in-depth analysis detailing your home's value as well as a comparison with similar homes in the area
Home Values in the Area
Average Home Value in this Area
Purchase History
| Date | Buyer | Sale Price | Title Company |
|---|---|---|---|
| Quarles Elisa | $389,000 | None Listed On Document | |
| Cook Candy | $227,000 | None Available | |
| Cabin Michael | $219,000 | None Available | |
| Halleran Scott C | $157,000 | -- |
Source: Public Records
Mortgage History
| Date | Status | Borrower | Loan Amount |
|---|---|---|---|
| Open | Quarles Elisa | $389,000 | |
| Previous Owner | Cabin Michael | $153,300 | |
| Previous Owner | Halleran Scott C | $143,000 |
Source: Public Records
Tax History Compared to Growth
Tax History
| Year | Tax Paid | Tax Assessment Tax Assessment Total Assessment is a certain percentage of the fair market value that is determined by local assessors to be the total taxable value of land and additions on the property. | Land | Improvement |
|---|---|---|---|---|
| 2025 | $2,265 | $244,400 | -- | $244,400 |
| 2024 | $2,265 | $244,400 | -- | $244,400 |
| 2023 | $2,265 | $244,400 | $0 | $244,400 |
| 2022 | $2,178 | $244,400 | $0 | $0 |
| 2021 | $2,178 | $244,400 | $0 | $0 |
| 2020 | $2,027 | $211,600 | $0 | $0 |
| 2019 | $2,027 | $211,600 | $0 | $0 |
| 2018 | $2,027 | $211,600 | $0 | $0 |
| 2017 | $1,024 | $127,300 | $0 | $0 |
| 2016 | $687 | $0 | $0 | $0 |
| 2015 | $1,374 | $127,300 | $0 | $0 |
| 2014 | $1,354 | $127,300 | $0 | $0 |
Source: Public Records
Map
Nearby Homes
- 6 Village Ln Unit B100
- 6 Village Ln Unit B101
- 56 Shady Oak Dr
- 20 Kenilwood Place
- 12 Pelham Rd
- 310 Bowling Park Rd
- 203 Bowling Park Rd
- 114 Bowling Park Rd
- 303 Bowling Park Rd
- 111 Bowling Park Rd Unit 111
- 204 Bowling Park Rd
- 429 Bowling Park Rd
- 65 Eastview Ave
- 1 Kenilworth Rd
- 11 Kenilworth Rd
- 99999 Sterling St
- 19 Castle St
- 110 Unadilla Ave
- 38 Unadilla Alley
- 30 Caledonia Rd
- 18 Brook St Unit 208
- 18 Brook St
- 18 Brook St Unit 102
- 18 Brook St Unit 20
- 18 Brook St Unit 20
- 18 Brook St Unit 20
- 18 Brook St Unit 20
- 18 Brook St Unit 20
- 18 Brook St Unit 20
- 18 Brook St Unit 20
- 18 Brook St Unit 203
- 1 Brook St Unit L
- 12 Brook St
- 1 All Souls Crescent Unit 200
- 1 All Souls Crescent Unit B
- 1 All Souls Crescent
- 19 Brook St Unit 206
- 19 Brook St Unit 205
- 19 Brook St Unit 204
- 19 Brook St Unit 203