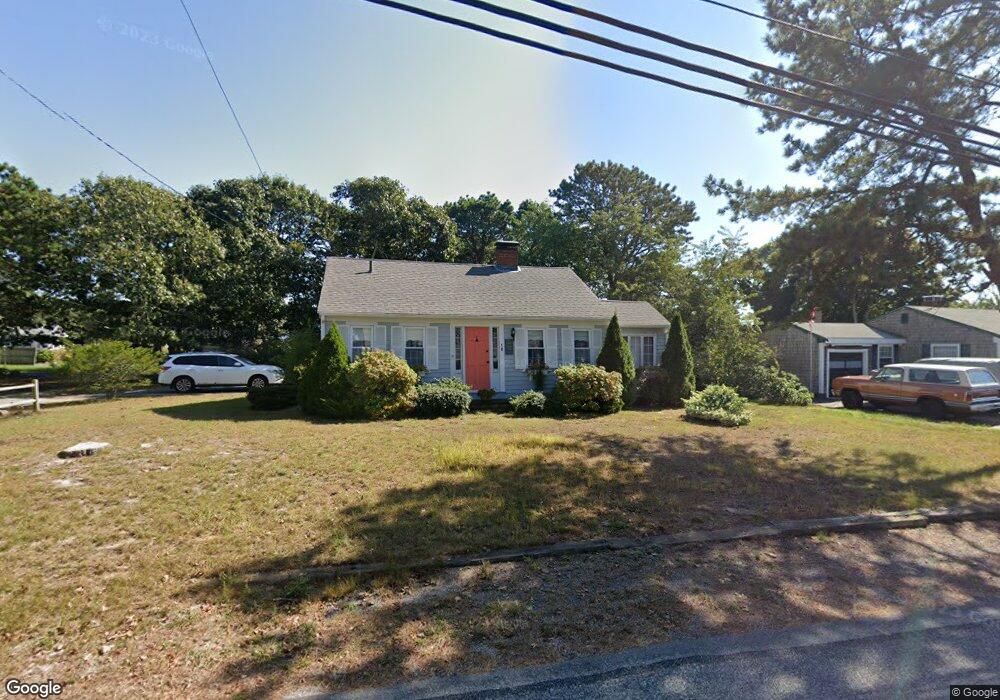
18 Buckley Rd West Dennis, MA 02670
West Dennis NeighborhoodEstimated Value: $563,000 - $795,000
3
Beds
1
Bath
800
Sq Ft
$880/Sq Ft
Est. Value
About This Home
This home is located at 18 Buckley Rd, West Dennis, MA 02670 and is currently estimated at $704,295, approximately $880 per square foot. 18 Buckley Rd is a home located in Barnstable County with nearby schools including Dennis-Yarmouth Regional High School and St. Pius X. School.
Ownership History
Date
Name
Owned For
Owner Type
Purchase Details
Closed on
Dec 9, 1996
Sold by
Jones John M and Jones Cathy
Bought by
Adams Kenneth R and Adams Martha A
Current Estimated Value
Home Financials for this Owner
Home Financials are based on the most recent Mortgage that was taken out on this home.
Original Mortgage
$102,000
Outstanding Balance
$10,490
Interest Rate
7.83%
Mortgage Type
Purchase Money Mortgage
Estimated Equity
$693,805
Purchase Details
Closed on
Aug 12, 1994
Sold by
Diemer Dennis J and Diemer Sandra M
Bought by
Jones John M and Jones Cathy
Create a Home Valuation Report for This Property
The Home Valuation Report is an in-depth analysis detailing your home's value as well as a comparison with similar homes in the area
Home Values in the Area
Average Home Value in this Area
Purchase History
| Date | Buyer | Sale Price | Title Company |
|---|---|---|---|
| Adams Kenneth R | $127,500 | -- | |
| Jones John M | $87,000 | -- |
Source: Public Records
Mortgage History
| Date | Status | Borrower | Loan Amount |
|---|---|---|---|
| Open | Jones John M | $102,000 | |
| Previous Owner | Jones John M | $82,200 |
Source: Public Records
Tax History Compared to Growth
Tax History
| Year | Tax Paid | Tax Assessment Tax Assessment Total Assessment is a certain percentage of the fair market value that is determined by local assessors to be the total taxable value of land and additions on the property. | Land | Improvement |
|---|---|---|---|---|
| 2025 | $2,998 | $692,300 | $406,700 | $285,600 |
| 2024 | $2,574 | $586,400 | $326,000 | $260,400 |
| 2023 | $2,490 | $533,100 | $296,300 | $236,800 |
| 2022 | $2,472 | $441,500 | $266,900 | $174,600 |
| 2021 | $2,405 | $398,800 | $261,700 | $137,100 |
| 2020 | $2,563 | $420,100 | $290,800 | $129,300 |
| 2019 | $2,445 | $396,300 | $285,100 | $111,200 |
| 2018 | $2,395 | $377,800 | $271,400 | $106,400 |
| 2017 | $2,156 | $350,600 | $244,200 | $106,400 |
| 2016 | $2,234 | $342,100 | $249,700 | $92,400 |
| 2015 | $2,189 | $342,100 | $249,700 | $92,400 |
| 2014 | $2,153 | $339,100 | $249,700 | $89,400 |
Source: Public Records
Map
Nearby Homes
- 2 Rita Mary Way
- 14 Schoolhouse Ln
- 209 Main St Unit 3
- 209 Main St Unit 6
- 209 Main St Unit 1
- 209 Main St Unit 2
- 209 Main St Unit 4
- 209 Main St Unit 5
- 178 School St
- 181 Pleasant St
- 308 Old Main St
- 23 Doric Ave
- 45 Seth Ln
- 40 Kelley Rd
- 401 Main St Unit 201
- 401 Main St Unit 101
- 745 Willow St
- 22 Powhatan Rd
- 29 Bass River Rd
- 467 Main St