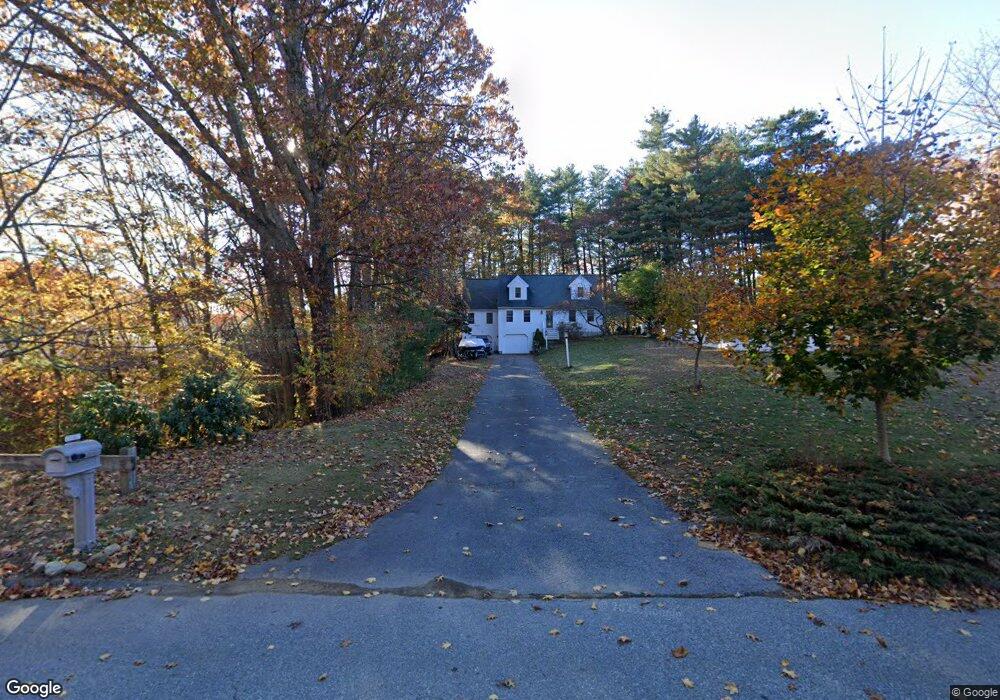
18 Burnside Ln Merrimac, MA 01860
Estimated Value: $638,000 - $697,934
2
Beds
2
Baths
1,797
Sq Ft
$374/Sq Ft
Est. Value
About This Home
This home is located at 18 Burnside Ln, Merrimac, MA 01860 and is currently estimated at $672,234, approximately $374 per square foot. 18 Burnside Ln is a home located in Essex County with nearby schools including Pentucket Regional High School.
Ownership History
Date
Name
Owned For
Owner Type
Purchase Details
Closed on
Aug 2, 2007
Sold by
Deutsche Bank Natl T C
Bought by
Cousins Scot E
Current Estimated Value
Purchase Details
Closed on
Feb 26, 2007
Sold by
Dunklee Katherine M
Bought by
Deutsche Bank Natl T C
Purchase Details
Closed on
Feb 27, 2004
Sold by
Maiella Patrick G
Bought by
Dunklee Gerald W and Dunklee Katherine M
Purchase Details
Closed on
Aug 29, 2002
Sold by
Maiella Patrick G and Maiella Dana J
Bought by
Maiella Patrick G
Purchase Details
Closed on
Dec 22, 2000
Sold by
Foster Brian M and Foster Angela C
Bought by
Maiella Patrick G and Maiella Dana J
Purchase Details
Closed on
Jun 18, 1999
Sold by
Bragdon 3D Nathaniel W and Bragdon Susan C
Bought by
Foster Brian M and Foster Angela C
Purchase Details
Closed on
Mar 18, 1994
Sold by
Homes By Chet Inc
Bought by
Bragdon Nathaniel and Bragdon Susan
Create a Home Valuation Report for This Property
The Home Valuation Report is an in-depth analysis detailing your home's value as well as a comparison with similar homes in the area
Home Values in the Area
Average Home Value in this Area
Purchase History
| Date | Buyer | Sale Price | Title Company |
|---|---|---|---|
| Cousins Scot E | $305,000 | -- | |
| Deutsche Bank Natl T C | $369,974 | -- | |
| Dunklee Gerald W | $340,000 | -- | |
| Maiella Patrick G | $20,000 | -- | |
| Maiella Patrick G | $242,450 | -- | |
| Foster Brian M | $226,000 | -- | |
| Bragdon Nathaniel | $154,130 | -- |
Source: Public Records
Mortgage History
| Date | Status | Borrower | Loan Amount |
|---|---|---|---|
| Open | Bragdon Nathaniel | $251,000 | |
| Closed | Bragdon Nathaniel | $252,000 |
Source: Public Records
Tax History Compared to Growth
Tax History
| Year | Tax Paid | Tax Assessment Tax Assessment Total Assessment is a certain percentage of the fair market value that is determined by local assessors to be the total taxable value of land and additions on the property. | Land | Improvement |
|---|---|---|---|---|
| 2025 | $8,211 | $619,700 | $315,100 | $304,600 |
| 2024 | $8,330 | $617,000 | $315,100 | $301,900 |
| 2023 | $7,753 | $524,900 | $273,100 | $251,800 |
| 2022 | $7,397 | $452,700 | $227,600 | $225,100 |
| 2021 | $7,314 | $448,700 | $227,600 | $221,100 |
| 2020 | $6,677 | $448,700 | $227,600 | $221,100 |
| 2019 | $5,734 | $362,700 | $168,100 | $194,600 |
| 2018 | $5,505 | $349,300 | $150,600 | $198,700 |
| 2017 | $5,539 | $339,000 | $150,600 | $188,400 |
| 2016 | $5,312 | $328,700 | $150,600 | $178,100 |
| 2015 | $5,213 | $320,800 | $150,600 | $170,200 |
| 2014 | $5,098 | $320,800 | $150,600 | $170,200 |
Source: Public Records
Map
Nearby Homes
- 20 Burnside Ln
- 16 Burnside Ln
- 14 Burnside Ln
- 22 Burnside Ln
- 19 Burnside Ln
- 23 Burnside Ln
- 17 Burnside Ln
- 24 Burnside Ln
- 15 Burnside Ln
- 14 Dunvegan Dr
- 25 Burnside Ln
- 10 Dunvegan Dr
- 12 Burnside Ln
- 27 Burnside Ln
- 11 Burnside Ln
- 101 Dunvegan Dr
- 8 Dunvegan Dr
- 29 Burnside Ln
- 29 Burnside Ln Unit lane
- 11 Dunvegan Dr