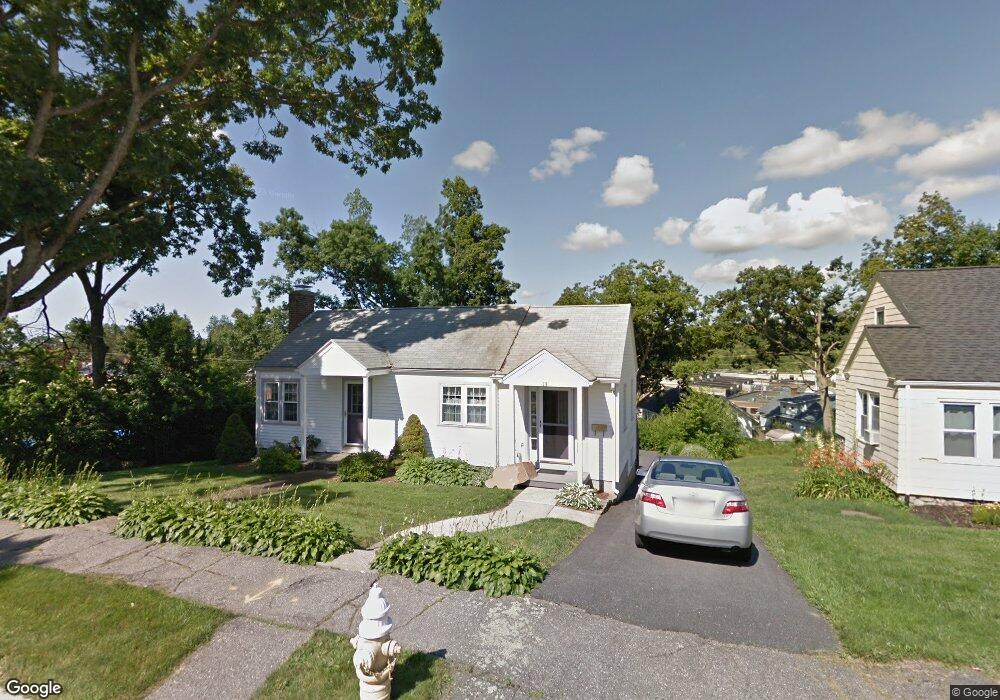
18 Button St Worcester, MA 01606
Greendale NeighborhoodEstimated Value: $363,000 - $396,000
2
Beds
1
Bath
1,112
Sq Ft
$343/Sq Ft
Est. Value
About This Home
This home is located at 18 Button St, Worcester, MA 01606 and is currently estimated at $381,813, approximately $343 per square foot. 18 Button St is a home located in Worcester County with nearby schools including Belmont Street Community School, Jacob Hiatt Magnet School, and Chandler Magnet.
Ownership History
Date
Name
Owned For
Owner Type
Purchase Details
Closed on
Aug 21, 2009
Sold by
Barclays Capital Re In
Bought by
Rossi Nancy J
Current Estimated Value
Purchase Details
Closed on
Jul 31, 1991
Sold by
Gardner Mary K
Bought by
Mccarroll Lynn
Home Financials for this Owner
Home Financials are based on the most recent Mortgage that was taken out on this home.
Original Mortgage
$85,500
Interest Rate
9.58%
Mortgage Type
Purchase Money Mortgage
Create a Home Valuation Report for This Property
The Home Valuation Report is an in-depth analysis detailing your home's value as well as a comparison with similar homes in the area
Home Values in the Area
Average Home Value in this Area
Purchase History
| Date | Buyer | Sale Price | Title Company |
|---|---|---|---|
| Rossi Nancy J | $48,500 | -- | |
| Mccarroll Lynn | $95,000 | -- |
Source: Public Records
Mortgage History
| Date | Status | Borrower | Loan Amount |
|---|---|---|---|
| Previous Owner | Mccarroll Lynn | $135,000 | |
| Previous Owner | Mccarroll Lynn | $90,000 | |
| Previous Owner | Mccarroll Lynn | $82,400 | |
| Previous Owner | Mccarroll Lynn | $85,500 |
Source: Public Records
Tax History
| Year | Tax Paid | Tax Assessment Tax Assessment Total Assessment is a certain percentage of the fair market value that is determined by local assessors to be the total taxable value of land and additions on the property. | Land | Improvement |
|---|---|---|---|---|
| 2025 | $4,363 | $330,800 | $118,700 | $212,100 |
| 2024 | $4,213 | $306,400 | $118,700 | $187,700 |
| 2023 | $4,028 | $280,900 | $103,200 | $177,700 |
| 2022 | $3,688 | $242,500 | $82,600 | $159,900 |
| 2021 | $3,479 | $213,700 | $66,100 | $147,600 |
| 2020 | $3,341 | $196,500 | $66,100 | $130,400 |
| 2019 | $3,211 | $178,400 | $59,500 | $118,900 |
| 2018 | $3,220 | $170,300 | $59,500 | $110,800 |
| 2017 | $3,089 | $160,700 | $59,500 | $101,200 |
| 2016 | $3,005 | $145,800 | $43,700 | $102,100 |
| 2015 | $2,926 | $145,800 | $43,700 | $102,100 |
| 2014 | $2,849 | $145,800 | $43,700 | $102,100 |
Source: Public Records
Map
Nearby Homes
Your Personal Tour Guide
Ask me questions while you tour the home.