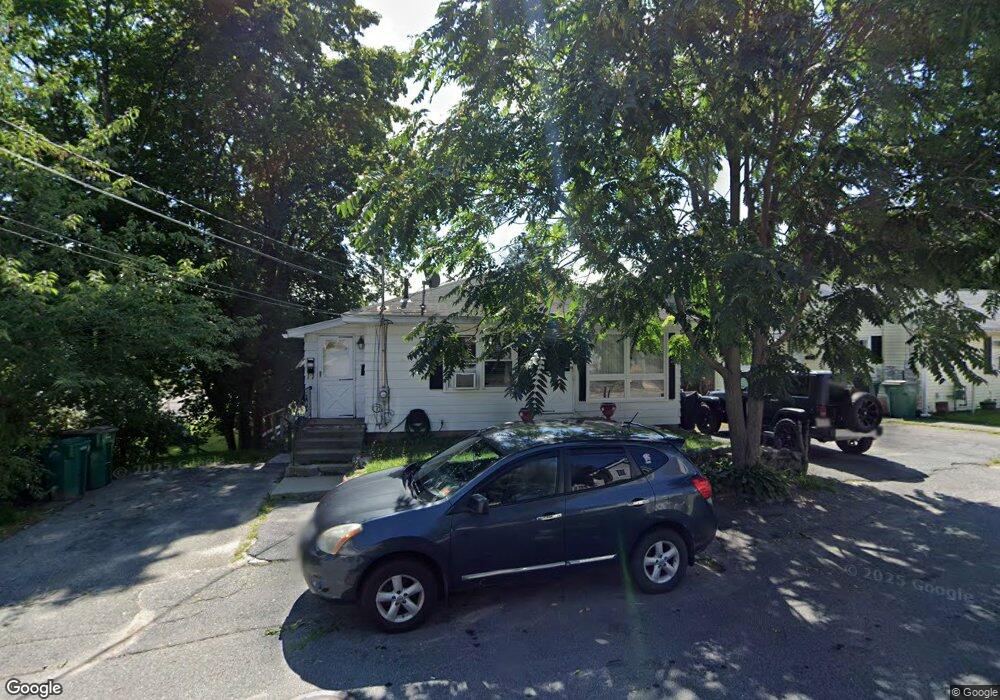
18 Cane St Fitchburg, MA 01420
Estimated Value: $364,000 - $424,429
4
Beds
3
Baths
1,040
Sq Ft
$375/Sq Ft
Est. Value
About This Home
This home is located at 18 Cane St, Fitchburg, MA 01420 and is currently estimated at $390,107, approximately $375 per square foot. 18 Cane St is a home located in Worcester County with nearby schools including South Street Elementary School, Crocker Elementary School, and Reingold Elementary School.
Ownership History
Date
Name
Owned For
Owner Type
Purchase Details
Closed on
Aug 31, 2004
Sold by
Callahan Eric
Bought by
Callahan Eric and Callahan Renee
Current Estimated Value
Purchase Details
Closed on
Apr 1, 2002
Sold by
Williams John E and Williams Deborah A
Bought by
Dewar Roderick F and Silence Tracy L
Home Financials for this Owner
Home Financials are based on the most recent Mortgage that was taken out on this home.
Original Mortgage
$133,000
Interest Rate
6.88%
Mortgage Type
Purchase Money Mortgage
Purchase Details
Closed on
Apr 3, 2000
Sold by
Diconza Robert D and Diconza Janet R
Bought by
Williams John E and Williams Deborah A
Home Financials for this Owner
Home Financials are based on the most recent Mortgage that was taken out on this home.
Original Mortgage
$74,000
Interest Rate
8.4%
Mortgage Type
Purchase Money Mortgage
Purchase Details
Closed on
Mar 31, 2000
Sold by
Diconza Robert D and Diconza Janet R
Bought by
Williams John E and Williams Deborah A
Home Financials for this Owner
Home Financials are based on the most recent Mortgage that was taken out on this home.
Original Mortgage
$74,000
Interest Rate
8.4%
Mortgage Type
Purchase Money Mortgage
Create a Home Valuation Report for This Property
The Home Valuation Report is an in-depth analysis detailing your home's value as well as a comparison with similar homes in the area
Home Values in the Area
Average Home Value in this Area
Purchase History
| Date | Buyer | Sale Price | Title Company |
|---|---|---|---|
| Callahan Eric | -- | -- | |
| Dewar Roderick F | $140,000 | -- | |
| Williams John E | $74,000 | -- | |
| Williams John E | $74,000 | -- |
Source: Public Records
Mortgage History
| Date | Status | Borrower | Loan Amount |
|---|---|---|---|
| Open | Williams John E | $116,800 | |
| Previous Owner | Dewar Roderick F | $133,000 | |
| Previous Owner | Williams John E | $74,000 | |
| Previous Owner | Williams John E | $74,000 |
Source: Public Records
Tax History Compared to Growth
Tax History
| Year | Tax Paid | Tax Assessment Tax Assessment Total Assessment is a certain percentage of the fair market value that is determined by local assessors to be the total taxable value of land and additions on the property. | Land | Improvement |
|---|---|---|---|---|
| 2025 | $48 | $354,600 | $97,200 | $257,400 |
| 2024 | $4,523 | $305,400 | $59,600 | $245,800 |
| 2023 | $4,466 | $278,800 | $51,200 | $227,600 |
| 2022 | $4,034 | $229,100 | $42,900 | $186,200 |
| 2021 | $3,855 | $202,600 | $31,000 | $171,600 |
| 2020 | $3,727 | $189,100 | $28,600 | $160,500 |
| 2019 | $4,184 | $174,200 | $40,500 | $133,700 |
| 2018 | $3,240 | $154,200 | $38,100 | $116,100 |
| 2017 | $3,120 | $145,200 | $38,100 | $107,100 |
| 2016 | $2,993 | $141,000 | $34,500 | $106,500 |
| 2015 | $2,856 | $138,100 | $33,400 | $104,700 |
| 2014 | $2,865 | $144,500 | $33,400 | $111,100 |
Source: Public Records
Map
Nearby Homes