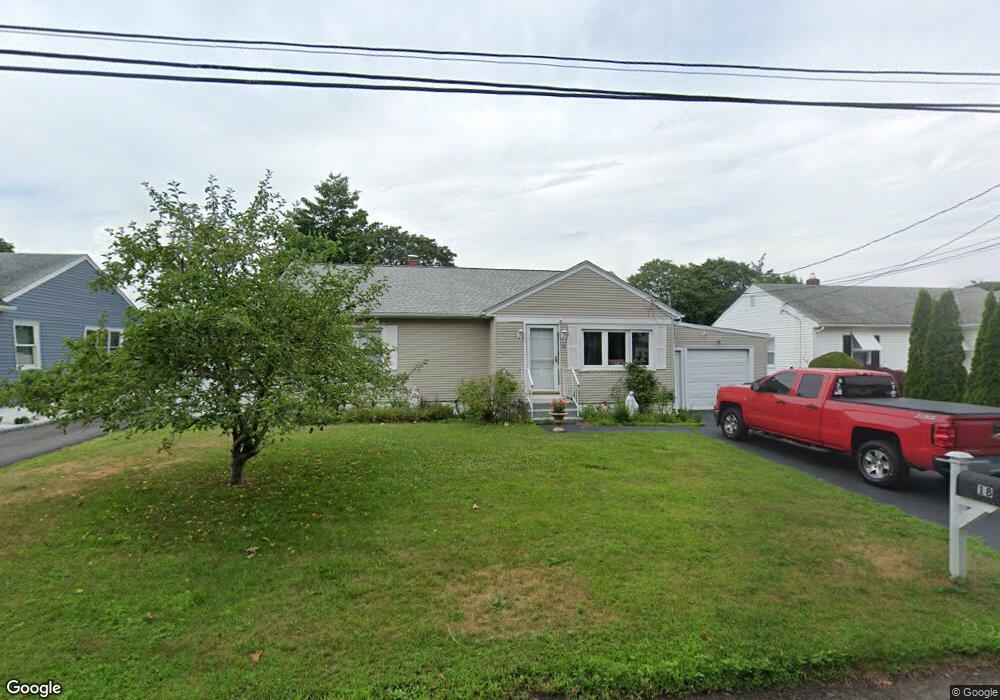
18 Canna Dr East Haven, CT 06512
Estimated Value: $346,097 - $430,000
2
Beds
1
Bath
1,152
Sq Ft
$334/Sq Ft
Est. Value
About This Home
This home is located at 18 Canna Dr, East Haven, CT 06512 and is currently estimated at $384,774, approximately $334 per square foot. 18 Canna Dr is a home located in New Haven County with nearby schools including East Haven High School and Pathway School.
Ownership History
Date
Name
Owned For
Owner Type
Purchase Details
Closed on
May 14, 2024
Sold by
Mary Jane Sheehy Ret and Sheehy
Bought by
Sheehy Marion and Sheehy
Current Estimated Value
Purchase Details
Closed on
May 8, 2001
Sold by
Cavallaro Paul A
Bought by
Sheehy Mary J and Sheehy Marion H
Home Financials for this Owner
Home Financials are based on the most recent Mortgage that was taken out on this home.
Original Mortgage
$110,000
Interest Rate
6.85%
Purchase Details
Closed on
Oct 14, 1998
Sold by
Fnma
Bought by
Cavallaro Paul A
Home Financials for this Owner
Home Financials are based on the most recent Mortgage that was taken out on this home.
Original Mortgage
$101,200
Interest Rate
6.8%
Mortgage Type
Purchase Money Mortgage
Create a Home Valuation Report for This Property
The Home Valuation Report is an in-depth analysis detailing your home's value as well as a comparison with similar homes in the area
Home Values in the Area
Average Home Value in this Area
Purchase History
| Date | Buyer | Sale Price | Title Company |
|---|---|---|---|
| Sheehy Marion | -- | None Available | |
| Marion E Sheehy Ret | -- | None Available | |
| Sheehy Marion | -- | None Available | |
| Sheehy Mary J | $150,000 | -- | |
| Cavallaro Paul A | $102,500 | -- | |
| Sheehy Mary J | $150,000 | -- | |
| Cavallaro Paul A | $102,500 | -- |
Source: Public Records
Mortgage History
| Date | Status | Borrower | Loan Amount |
|---|---|---|---|
| Previous Owner | Cavallaro Paul A | $94,120 | |
| Previous Owner | Cavallaro Paul A | $110,000 | |
| Previous Owner | Cavallaro Paul A | $101,200 |
Source: Public Records
Tax History
| Year | Tax Paid | Tax Assessment Tax Assessment Total Assessment is a certain percentage of the fair market value that is determined by local assessors to be the total taxable value of land and additions on the property. | Land | Improvement |
|---|---|---|---|---|
| 2025 | $5,204 | $155,610 | $57,540 | $98,070 |
| 2024 | $5,204 | $155,610 | $57,540 | $98,070 |
| 2023 | $4,855 | $155,610 | $57,540 | $98,070 |
| 2022 | $4,855 | $155,610 | $57,540 | $98,070 |
| 2021 | $4,165 | $121,610 | $51,160 | $70,450 |
| 2020 | $4,165 | $121,610 | $51,160 | $70,450 |
| 2019 | $3,943 | $121,610 | $51,160 | $70,450 |
| 2018 | $3,946 | $121,610 | $51,160 | $70,450 |
| 2017 | $3,837 | $121,610 | $51,160 | $70,450 |
| 2016 | $3,857 | $122,240 | $51,160 | $71,080 |
| 2015 | $3,857 | $122,240 | $51,160 | $71,080 |
| 2014 | $3,918 | $122,240 | $51,160 | $71,080 |
Source: Public Records
Map
Nearby Homes
- 3 Stoddard Rd
- 166 Beach Ave
- 44 Meadow View Rd
- 48 Morris Ave
- 560 Silver Sands Rd Unit 703
- 119 Cove St
- 19 Rhea St
- 114 Cove St
- 86 Cove St
- 506 Lighthouse Rd
- 16 Catherine St
- 262 & 264 Cosey Beach Ave
- 75 Townsend Ave
- 63 Coleman St Unit 12
- 216 Cosey Beach Ave
- 42 Oregon Ave
- 64 Coe Ave
- 15 Arden St
- 239 Coe Ave
- 26 Nelson St
Your Personal Tour Guide
Ask me questions while you tour the home.