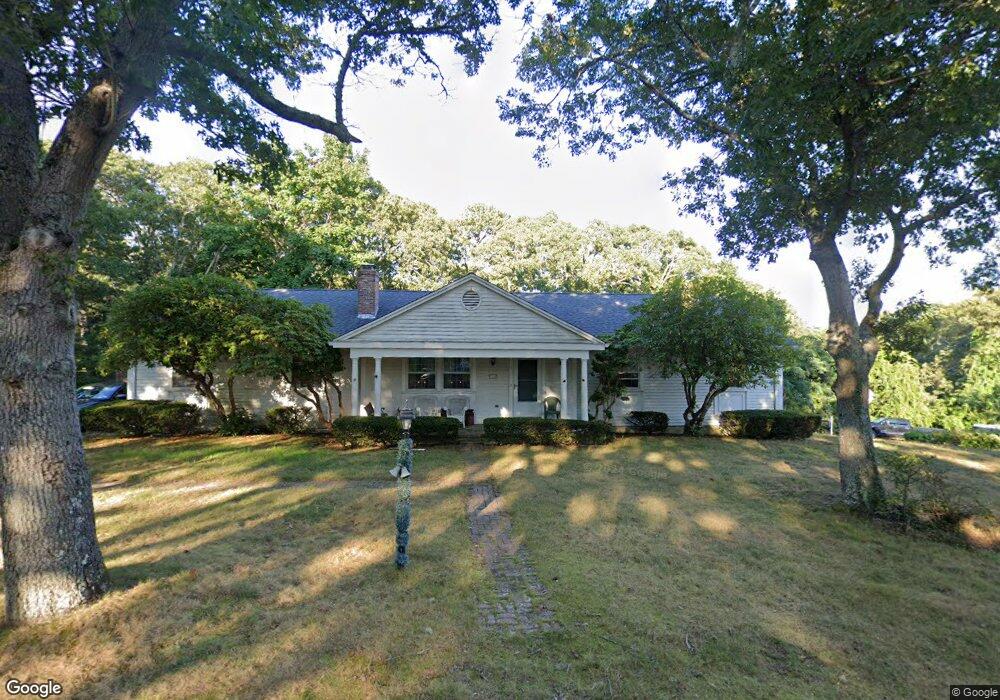
18 Canterbury Rd Yarmouth Port, MA 02675
Yarmouth Port NeighborhoodEstimated Value: $725,827 - $822,000
3
Beds
2
Baths
1,201
Sq Ft
$634/Sq Ft
Est. Value
About This Home
This home is located at 18 Canterbury Rd, Yarmouth Port, MA 02675 and is currently estimated at $761,457, approximately $634 per square foot. 18 Canterbury Rd is a home located in Barnstable County with nearby schools including Dennis-Yarmouth Regional High School and St. Pius X. School.
Ownership History
Date
Name
Owned For
Owner Type
Purchase Details
Closed on
Aug 8, 2024
Sold by
Scott Elsa S
Bought by
Scott Elsa S and Scott Jeffrey E
Current Estimated Value
Purchase Details
Closed on
Jun 24, 2004
Sold by
Gondola Alex A and Gondola Bonnie H
Bought by
Scott Bruce A and Scott Elsa S
Home Financials for this Owner
Home Financials are based on the most recent Mortgage that was taken out on this home.
Original Mortgage
$325,125
Interest Rate
6.32%
Mortgage Type
Purchase Money Mortgage
Purchase Details
Closed on
Jun 19, 1994
Sold by
Mckay William H and Mckay Kathleen M
Bought by
Gondola Alex A and Gondola Bonnie H
Home Financials for this Owner
Home Financials are based on the most recent Mortgage that was taken out on this home.
Original Mortgage
$70,000
Interest Rate
8.5%
Mortgage Type
Purchase Money Mortgage
Create a Home Valuation Report for This Property
The Home Valuation Report is an in-depth analysis detailing your home's value as well as a comparison with similar homes in the area
Home Values in the Area
Average Home Value in this Area
Purchase History
| Date | Buyer | Sale Price | Title Company |
|---|---|---|---|
| Scott Elsa S | -- | None Available | |
| Scott Elsa S | -- | None Available | |
| Scott Bruce A | $361,250 | -- | |
| Gondola Alex A | $148,000 | -- | |
| Scott Bruce A | $361,250 | -- | |
| Gondola Alex A | $148,000 | -- |
Source: Public Records
Mortgage History
| Date | Status | Borrower | Loan Amount |
|---|---|---|---|
| Previous Owner | Gondola Alex A | $180,000 | |
| Previous Owner | Scott Bruce A | $325,125 | |
| Previous Owner | Gondola Alex A | $70,000 |
Source: Public Records
Tax History Compared to Growth
Tax History
| Year | Tax Paid | Tax Assessment Tax Assessment Total Assessment is a certain percentage of the fair market value that is determined by local assessors to be the total taxable value of land and additions on the property. | Land | Improvement |
|---|---|---|---|---|
| 2025 | $5,252 | $741,800 | $238,500 | $503,300 |
| 2024 | $4,942 | $669,600 | $207,400 | $462,200 |
| 2023 | $4,747 | $585,300 | $175,100 | $410,200 |
| 2022 | $4,431 | $482,700 | $156,600 | $326,100 |
| 2021 | $4,137 | $432,700 | $156,600 | $276,100 |
| 2020 | $4,001 | $400,100 | $154,100 | $246,000 |
| 2019 | $3,677 | $364,100 | $154,100 | $210,000 |
| 2018 | $3,654 | $355,100 | $145,100 | $210,000 |
| 2017 | $3,558 | $355,100 | $145,100 | $210,000 |
| 2016 | $3,544 | $355,100 | $145,100 | $210,000 |
| 2015 | $3,408 | $339,400 | $145,100 | $194,300 |
Source: Public Records
Map
Nearby Homes
- 44 Stratford Ln
- 43 Canterbury Rd
- 86 Pompano Rd
- 34 Kates Path
- 34 Kates Path Unit 34
- 17 Kates Path Unit A
- 64 Kates Path
- 228 Kates Path
- 25 Oak Glen Village Unit 25
- 25 Oak Glen
- 1 Barnacle Rd
- 7 Forest Gate Unit 7
- 2 Pine Grove
- 50 John Hall Cartway
- 50 John Hall Cartway Unit 50
- 42 John Hall Cartway Unit 42
- 6 Nimble Hill Dr
- 30 W Woods Cir Unit 30
- 30 W Woods
- 51 Bray Farm Rd N