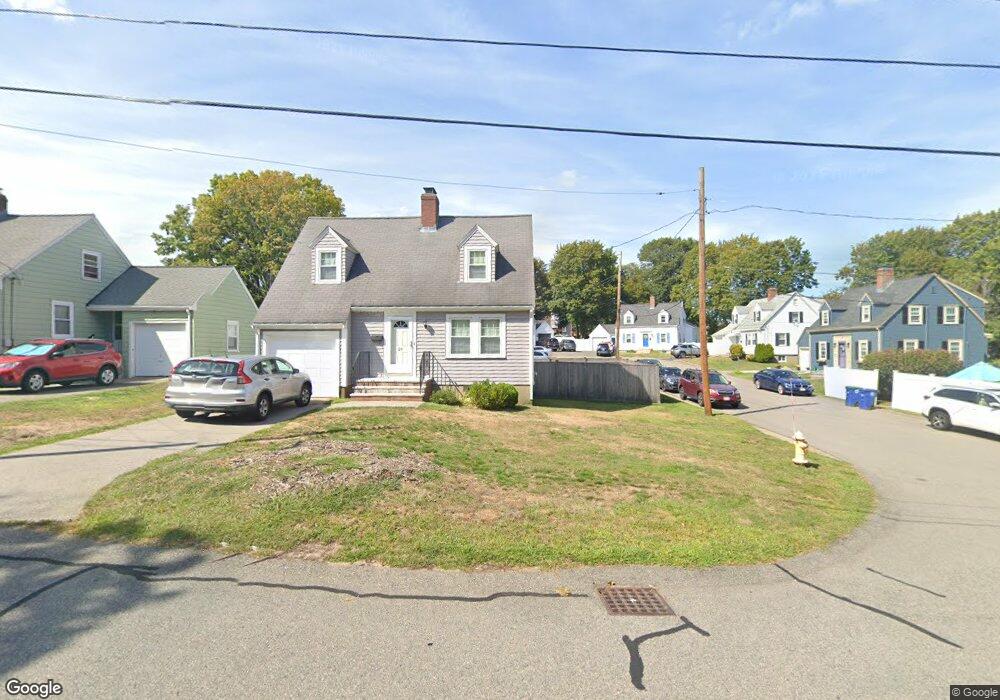
18 Cape Cod Ln Braintree, MA 02184
East Braintree NeighborhoodEstimated Value: $604,000 - $766,000
3
Beds
2
Baths
1,512
Sq Ft
$462/Sq Ft
Est. Value
About This Home
This home is located at 18 Cape Cod Ln, Braintree, MA 02184 and is currently estimated at $698,792, approximately $462 per square foot. 18 Cape Cod Ln is a home located in Norfolk County with nearby schools including Braintree High School, Sacred Heart Elementary School, and South Shore Christian Academy.
Ownership History
Date
Name
Owned For
Owner Type
Purchase Details
Closed on
Mar 2, 2010
Sold by
Shinney Paul and Shinney Marybeth
Bought by
Bjorlin Roy W and Bjorlin Courtney E
Current Estimated Value
Home Financials for this Owner
Home Financials are based on the most recent Mortgage that was taken out on this home.
Original Mortgage
$335,314
Outstanding Balance
$223,678
Interest Rate
5.11%
Mortgage Type
Purchase Money Mortgage
Estimated Equity
$475,114
Purchase Details
Closed on
Mar 30, 2005
Sold by
Mcvay Pauline C
Bought by
Shinney Marybeth and Shinney Paul
Home Financials for this Owner
Home Financials are based on the most recent Mortgage that was taken out on this home.
Original Mortgage
$284,000
Interest Rate
5.61%
Mortgage Type
Purchase Money Mortgage
Create a Home Valuation Report for This Property
The Home Valuation Report is an in-depth analysis detailing your home's value as well as a comparison with similar homes in the area
Home Values in the Area
Average Home Value in this Area
Purchase History
| Date | Buyer | Sale Price | Title Company |
|---|---|---|---|
| Bjorlin Roy W | $341,500 | -- | |
| Shinney Marybeth | $355,000 | -- |
Source: Public Records
Mortgage History
| Date | Status | Borrower | Loan Amount |
|---|---|---|---|
| Open | Bjorlin Roy W | $335,314 | |
| Previous Owner | Shinney Marybeth | $284,000 |
Source: Public Records
Tax History
| Year | Tax Paid | Tax Assessment Tax Assessment Total Assessment is a certain percentage of the fair market value that is determined by local assessors to be the total taxable value of land and additions on the property. | Land | Improvement |
|---|---|---|---|---|
| 2025 | $6,647 | $666,000 | $329,800 | $336,200 |
| 2024 | $5,970 | $629,700 | $299,500 | $330,200 |
| 2023 | $5,665 | $580,400 | $269,100 | $311,300 |
| 2022 | $4,812 | $483,600 | $243,000 | $240,600 |
| 2021 | $4,379 | $440,100 | $219,600 | $220,500 |
| 2020 | $4,142 | $420,100 | $199,600 | $220,500 |
| 2019 | $3,968 | $393,300 | $191,000 | $202,300 |
| 2018 | $3,877 | $367,800 | $173,600 | $194,200 |
| 2017 | $4,190 | $390,100 | $164,900 | $225,200 |
| 2016 | $4,105 | $373,900 | $156,200 | $217,700 |
| 2015 | $3,760 | $339,700 | $130,200 | $209,500 |
| 2014 | $3,632 | $318,000 | $125,000 | $193,000 |
Source: Public Records
Map
Nearby Homes
- 54 Edgemont Rd
- 87 Arborway Dr
- 140 Commercial St
- 312 Shaw St
- 18 Hobart St
- 41 Lantern Ln
- 37 Lantern Ln
- 122 Washington St Unit Twenty-two
- 26 Tingley Rd
- 300 Commercial St Unit 23
- 25 Richmond St
- 30 Skyline Dr Unit 6
- 37 Skyline Dr Unit 11
- 599 Union St
- 46 Roosevelt Rd
- 15 Summer St
- 19 Vine St Unit 2
- 70 Biscayne Ave
- 14 Hillside Rd
- 25 W Howard St Unit C3
- 19 Cape Cod Ln
- 14 Cape Cod Ln
- 36 Edgemont Rd
- 40 Edgemont Rd
- 34 Edgemont Rd
- 10 Cape Cod Ln
- 15 Cape Cod Ln
- 28 Edgemont Rd
- 50 Edgemont Rd
- 7 Cape Cod Ln
- 24 Edgemont Rd
- 39 Cedar Cliff Rd
- 29 Cedar Cliff Rd
- 52 Edgemont Rd
- 35 Cedar Cliff Rd
- 18 Edgemont Rd
- 21 Cedar Cliff Rd
- 39 Edgemont Rd
- 33 Edgemont Rd
- 27 Edgemont Rd
Your Personal Tour Guide
Ask me questions while you tour the home.