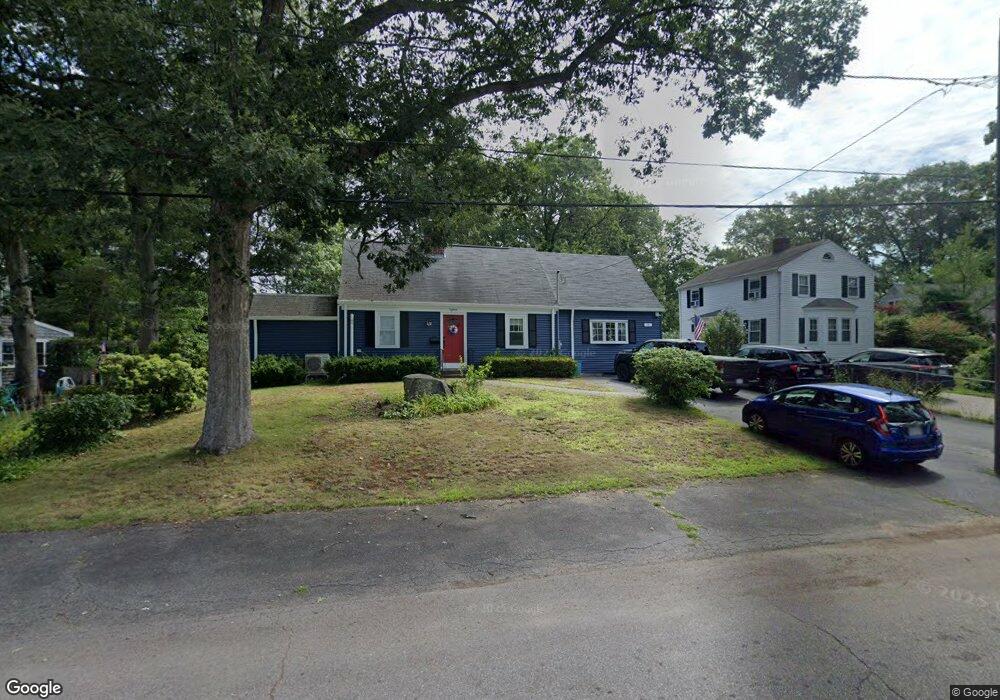
18 Carson St Weymouth, MA 02188
Weymouth Landing NeighborhoodEstimated Value: $739,000 - $1,030,000
--
Bed
4
Baths
2,244
Sq Ft
$367/Sq Ft
Est. Value
About This Home
This home is located at 18 Carson St, Weymouth, MA 02188 and is currently estimated at $824,119, approximately $367 per square foot. 18 Carson St is a home located in Norfolk County with nearby schools including Frederick C Murphy, Abigail Adams Middle School, and Weymouth Middle School Chapman.
Ownership History
Date
Name
Owned For
Owner Type
Purchase Details
Closed on
Nov 17, 1997
Sold by
Oleary Lauretta A and Oleary Gerard D
Bought by
Cotter Michael R and Cotter Cheryl W
Current Estimated Value
Home Financials for this Owner
Home Financials are based on the most recent Mortgage that was taken out on this home.
Original Mortgage
$194,700
Outstanding Balance
$31,812
Interest Rate
7.23%
Mortgage Type
Purchase Money Mortgage
Estimated Equity
$792,307
Create a Home Valuation Report for This Property
The Home Valuation Report is an in-depth analysis detailing your home's value as well as a comparison with similar homes in the area
Home Values in the Area
Average Home Value in this Area
Purchase History
| Date | Buyer | Sale Price | Title Company |
|---|---|---|---|
| Cotter Michael R | $205,000 | -- |
Source: Public Records
Mortgage History
| Date | Status | Borrower | Loan Amount |
|---|---|---|---|
| Open | Cotter Michael R | $80,000 | |
| Closed | Cotter Michael R | $31,000 | |
| Open | Cotter Michael R | $194,700 |
Source: Public Records
Tax History Compared to Growth
Tax History
| Year | Tax Paid | Tax Assessment Tax Assessment Total Assessment is a certain percentage of the fair market value that is determined by local assessors to be the total taxable value of land and additions on the property. | Land | Improvement |
|---|---|---|---|---|
| 2025 | $7,816 | $773,900 | $249,300 | $524,600 |
| 2024 | $7,577 | $737,800 | $237,500 | $500,300 |
| 2023 | $7,148 | $684,000 | $219,900 | $464,100 |
| 2022 | $6,939 | $605,500 | $203,600 | $401,900 |
| 2021 | $5,422 | $461,800 | $203,600 | $258,200 |
| 2020 | $5,229 | $438,700 | $203,600 | $235,100 |
| 2019 | $5,105 | $421,200 | $195,800 | $225,400 |
| 2018 | $5,046 | $403,700 | $194,200 | $209,500 |
| 2017 | $4,933 | $385,100 | $185,000 | $200,100 |
| 2016 | $4,787 | $374,000 | $177,900 | $196,100 |
| 2015 | $4,648 | $360,300 | $177,900 | $182,400 |
| 2014 | $4,409 | $331,500 | $165,600 | $165,900 |
Source: Public Records
Map
Nearby Homes
- 54 Federal St
- 24 Blake Rd
- 200 Justin Dr Unit 3
- 33 Congress St
- 76 Kingman St
- 116 Belmont St
- 215 Winter St Unit 1P
- 15 Summer St
- 16 Lindbergh Ave
- 23-25 Lindbergh Ave
- 747 Middle St
- 2 Tara Dr Unit 1
- 19 Vine St Unit 3
- 19 Vine St Unit 1
- 114 Broad St Unit D
- 114 Broad St Unit C
- 501 Commerce Dr Unit 2310
- 501 Commerce Dr Unit 1111
- 501 Commerce Dr Unit 4206
- 501 Commerce Dr Unit 4308