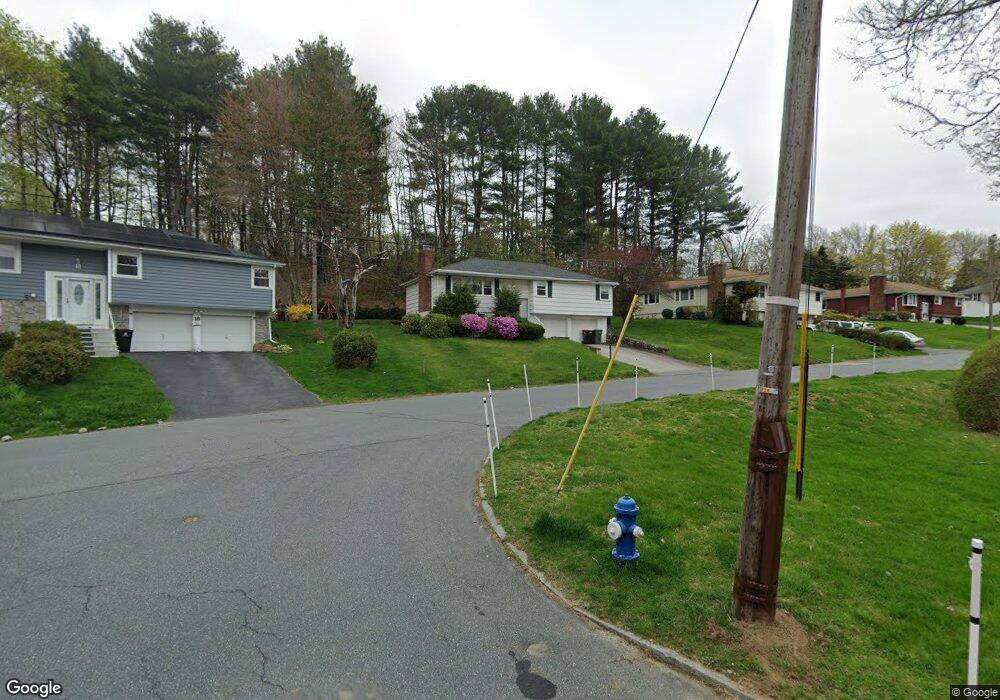
18 Cherry Rd Framingham, MA 01701
Estimated Value: $606,000 - $653,000
3
Beds
2
Baths
1,427
Sq Ft
$434/Sq Ft
Est. Value
About This Home
This home is located at 18 Cherry Rd, Framingham, MA 01701 and is currently estimated at $619,499, approximately $434 per square foot. 18 Cherry Rd is a home located in Middlesex County with nearby schools including Framingham High School, Christa McAuliffe Charter School, and Happy Hollow School.
Ownership History
Date
Name
Owned For
Owner Type
Purchase Details
Closed on
May 16, 2017
Sold by
Lerman Jared and Lerman Jennifer
Bought by
Friedman Jennifer M
Current Estimated Value
Purchase Details
Closed on
Sep 1, 2010
Sold by
Mccabe John K and Mccabe John M
Bought by
Lerman Jared and Lerman Jennifer
Home Financials for this Owner
Home Financials are based on the most recent Mortgage that was taken out on this home.
Original Mortgage
$232,000
Interest Rate
4.55%
Mortgage Type
Purchase Money Mortgage
Purchase Details
Closed on
Apr 20, 1995
Sold by
Gogliormella Anna T
Bought by
Mccabe John M and Mccabe Judith
Create a Home Valuation Report for This Property
The Home Valuation Report is an in-depth analysis detailing your home's value as well as a comparison with similar homes in the area
Home Values in the Area
Average Home Value in this Area
Purchase History
| Date | Buyer | Sale Price | Title Company |
|---|---|---|---|
| Friedman Jennifer M | -- | -- | |
| Lerman Jared | $290,000 | -- | |
| Mccabe John M | $160,000 | -- | |
| Mccabe John M | $160,000 | -- |
Source: Public Records
Mortgage History
| Date | Status | Borrower | Loan Amount |
|---|---|---|---|
| Previous Owner | Lerman Jared | $232,000 |
Source: Public Records
Tax History
| Year | Tax Paid | Tax Assessment Tax Assessment Total Assessment is a certain percentage of the fair market value that is determined by local assessors to be the total taxable value of land and additions on the property. | Land | Improvement |
|---|---|---|---|---|
| 2025 | $6,707 | $561,700 | $268,100 | $293,600 |
| 2024 | $6,140 | $492,800 | $239,400 | $253,400 |
| 2023 | $5,627 | $429,900 | $213,700 | $216,200 |
| 2022 | $5,331 | $388,000 | $193,900 | $194,100 |
| 2021 | $5,319 | $378,600 | $186,400 | $192,200 |
| 2020 | $5,331 | $355,900 | $169,400 | $186,500 |
| 2019 | $5,243 | $340,900 | $169,400 | $171,500 |
| 2018 | $5,136 | $314,700 | $163,100 | $151,600 |
| 2017 | $4,988 | $298,500 | $158,300 | $140,200 |
| 2016 | $4,896 | $281,700 | $158,300 | $123,400 |
| 2015 | $4,929 | $276,600 | $158,900 | $117,700 |
Source: Public Records
Map
Nearby Homes
- 7 Ballydrain Rd
- Lot 3 Murray Hill Rd
- 14 Ridgefield Dr
- 8 Emily Rd
- 108 Cherry St
- 30 Donlon St
- 56 Greenleaf Cir
- 46 Cochituate Rd Unit 106
- 35 Gleason St
- 447 Old Connecticut Path
- 107 Lockland Ave
- 27 Valentine Rd
- 9 Palmer Rd
- 30 A St
- 689 Old Connecticut Path
- 46 Perry Henderson Dr
- 16 Grant Street Extension
- 46 Brookfield Cir
- 11 Danforth Park Rd
- 369 Grant St
Your Personal Tour Guide
Ask me questions while you tour the home.