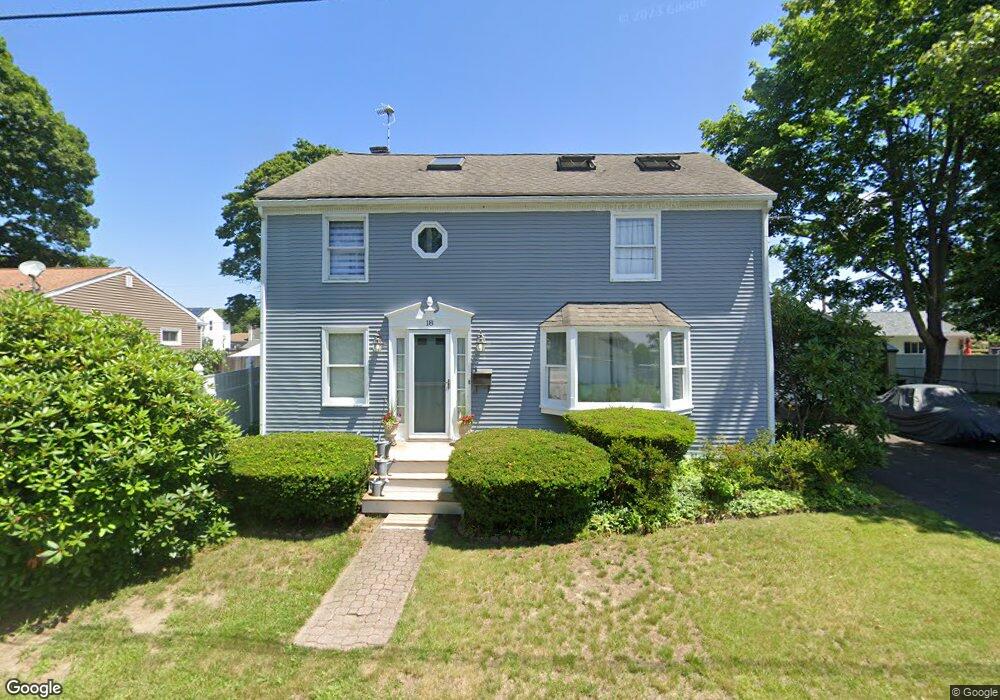
18 Chestnut St Swansea, MA 02777
Ocean Grove NeighborhoodEstimated Value: $455,000 - $532,000
4
Beds
2
Baths
1,568
Sq Ft
$314/Sq Ft
Est. Value
About This Home
This home is located at 18 Chestnut St, Swansea, MA 02777 and is currently estimated at $491,940, approximately $313 per square foot. 18 Chestnut St is a home located in Bristol County with nearby schools including Joseph Case High School and Swansea Wood School.
Ownership History
Date
Name
Owned For
Owner Type
Purchase Details
Closed on
Aug 15, 2025
Sold by
Gannon Deborah J and Treloar Paul
Bought by
Gannon Deborah J
Current Estimated Value
Purchase Details
Closed on
Mar 12, 2022
Sold by
Gannon Deborah J
Bought by
Gannon Deborah J
Purchase Details
Closed on
May 24, 2007
Sold by
Gannon Deborah J
Bought by
Gannon Deborah J and Gannon Kelli
Purchase Details
Closed on
Aug 27, 2004
Sold by
Talin Debra S and Talin Steven G
Bought by
Gannon Deborah J
Home Financials for this Owner
Home Financials are based on the most recent Mortgage that was taken out on this home.
Original Mortgage
$222,400
Interest Rate
6.02%
Mortgage Type
Purchase Money Mortgage
Create a Home Valuation Report for This Property
The Home Valuation Report is an in-depth analysis detailing your home's value as well as a comparison with similar homes in the area
Home Values in the Area
Average Home Value in this Area
Purchase History
| Date | Buyer | Sale Price | Title Company |
|---|---|---|---|
| Gannon Deborah J | -- | -- | |
| Gannon Deborah J | -- | -- | |
| Gannon Deborah J | -- | None Available | |
| Gannon Deborah J | -- | None Available | |
| Gannon Deborah J | -- | -- | |
| Gannon Deborah J | -- | -- | |
| Gannon Deborah J | $278,000 | -- | |
| Gannon Deborah J | $278,000 | -- |
Source: Public Records
Mortgage History
| Date | Status | Borrower | Loan Amount |
|---|---|---|---|
| Previous Owner | Gannon Deborah J | $222,400 | |
| Previous Owner | Gannon Deborah J | $41,700 | |
| Previous Owner | Gannon Deborah J | $5,000 |
Source: Public Records
Tax History Compared to Growth
Tax History
| Year | Tax Paid | Tax Assessment Tax Assessment Total Assessment is a certain percentage of the fair market value that is determined by local assessors to be the total taxable value of land and additions on the property. | Land | Improvement |
|---|---|---|---|---|
| 2025 | $4,470 | $375,000 | $159,000 | $216,000 |
| 2024 | $4,436 | $370,000 | $155,000 | $215,000 |
| 2023 | $3,902 | $297,200 | $113,800 | $183,400 |
| 2022 | $3,705 | $257,500 | $103,400 | $154,100 |
| 2021 | $3,718 | $237,900 | $101,400 | $136,500 |
| 2020 | $3,766 | $241,700 | $104,900 | $136,800 |
| 2019 | $3,598 | $232,000 | $91,900 | $140,100 |
| 2018 | $3,421 | $223,900 | $85,300 | $138,600 |
| 2017 | $3,052 | $229,800 | $92,700 | $137,100 |
| 2016 | $2,809 | $207,800 | $78,900 | $128,900 |
| 2015 | $2,726 | $207,600 | $78,900 | $128,700 |
| 2014 | $2,545 | $198,200 | $78,900 | $119,300 |
Source: Public Records
Map
Nearby Homes
- 153 Puffer Ave
- 20 Sherbourne Ave
- 193 Linden St
- 41 James Ave
- 25 Inverness Rd
- 502 Ocean Grove Ave
- 41,43,& 55 Laurel Ave
- 105 Birchwood Dr
- 196 Coolidge St
- 34 Columbia Rd
- 159 Wilder St
- 19 Richard Rd
- 110 Seaview Ave
- 19 Keller Ave
- 123 Calef Ave
- 79 Cedar Ave
- 95 Winslow Way
- 447 Old Warren Rd
- 127 Sheraton Ave
- 8 2nd St